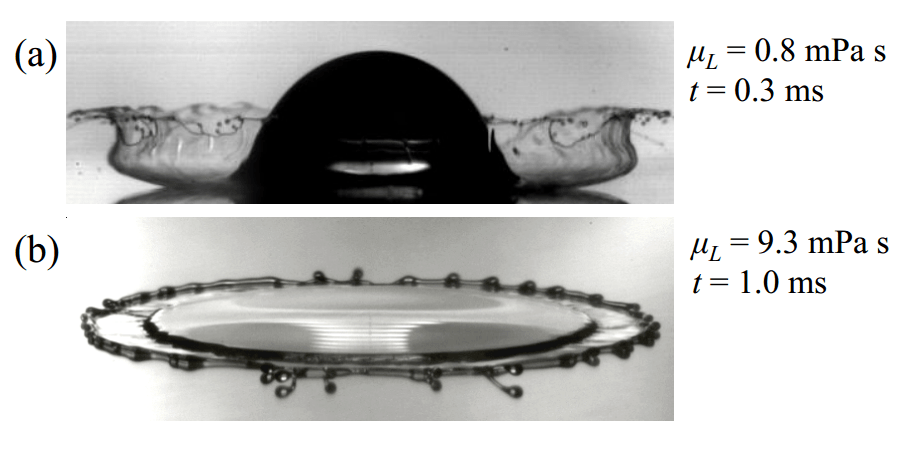
Everyone has seen drops of liquid falling onto a dry surface, yet the process is still being unraveled by researchers. We have learned, for example, that lowering the ambient air pressure can completely suppress splashing. Viscosity of the fluid also clearly plays a role, but the relationship between these and other variables is unclear. The images above show two droplet impacts in which the viscosity differs. The top image shows a low viscosity fluid, which almost immediately after impact forms a thin expanding sheet of fluid that lifts off the surface to create a crownlike splash. In contrast, the higher viscosity fluid in the bottom image spreads as a thick lamella with a thinner outer sheet that breaks down at the rim. Researchers found that both the high- and low-viscosity fluids have splashes featuring these thin liquid sheets, but the time scales on which the sheet develops differ. Moreover, lowering the ambient pressure increases the time required for the sheet to develop regardless of the fluid’s viscosity. (Image credit: C. Stevens et al.; submitted by @ASoutIglesias)
Category: Research

When Jets Collide
When two jets of a viscous liquid collide, they can form a chain-like stream or even a fishbone pattern, depending on the flow rate. This video demonstrates the menagerie of shapes that form not only with changing flow rates but by changing how the jets collide – from a glancing impingement to direct collision. When just touching, the viscous jets generate long threads of fluid that tear off and form tiny satellite droplets. At low flow rates, continuing to bring the jets closer causes them to twist around one another, releasing a series of pinched-off droplets. At higher flow rates, bringing the jets closer to each other creates a thin webbing of fluid between the jets that ultimately becomes a full fishbone pattern when the jets fully collide. The surface-tension-driven Plateau-Rayleigh instability helps drive the pinch-off and break-up into droplets. (Video credit: B. Keshavarz and G. McKinley)

Spinning Polygons


Nature is full of surprising behaviors. If one imagines putting a bucket of water on a rotating plate and spinning it, one would expect the water’s free surface to take on a curved, axially symmetric shape. The photos above are from a similar experiment, but instead of the entire container rotating, only the bottom plate spins. Surprisingly, the water’s surface does not remain symmetric around the axis of rotation. Instead, the water forms stable polygon shapes that rotate slower than the spinning plate. As the plate’s rotation speed increases, the number of corners in the polygon increases. Shapes up to a hexagon were observed in the experiment. Photos of the set-up and more experimental results are available, as is the original research paper. Symmetry breaking and polygons can also be found in hydraulic jumps and bumps, liquid sheets, and planetary polar vortices. (Photo credit: T. Jansson et al.; research paper)
Knotting Vortices
Knots have long fascinated humans, appearing in art for thousands of years and generating entire fields of study. Until recently, however, the idea of a knotted fluid was purely theoretical. To knot fluids, researchers used 3D printing to create twisted hydrofoil shapes. When towed through water, fluid travels around the shape and spins up at the trailing edge, creating a knotted vortex ring. The knotted vortices were captured with 3D imaging, allowing scientists to observe how they evolve. So far the knots they’ve created have all been unstable, deforming until two vortex lines approach one another. Upon contact, the vortices disconnect and reconnect with one another, unraveling the knot. Intriguingly, these vortex reconnections seem remarkably similar to the vortex reconnections observed between quantized vortices in superfluids. (Video credit: D. Kleckner et al.)

Sochi 2014: Why is Ice Slippery?
Ice is a key component of many Winter Olympic disciplines, including figure skating, hockey, speed skating, curling, and the sliding sports. The low friction and slippery nature of the ice are vital to the events, but oddly enough, scientists don’t yet fully understand why ice is slippery. A common explanation is that the narrow blades on which athletes compete cause extremely high pressures that locally melts the ice, creating a thin layer of water upon which the athlete glides. The trouble with this explanation is that it only accounts for ice being slippery within a few degrees of its melting point. Not only that, anyone who has fallen when walking on ice knows that it is slippery even without ice skates. In 1859 physicist Michael Faraday suggested that ice may be covered in a thin liquid-like layer even at temperatures well below freezing. Experiments since then suggest that this layer is tens or hundreds of nanometers thick, depending on the purity of the surface film. Robert Rosenberg has an excellent review of the subject in Physics Today. (Image credit: Reuters/D. Gray via The Big Picture)
This post opens up our series on fluid dynamics in the Winter Olympics. Stay tuned for more over the next two weeks. Got a question in mind? Seen a great article? Feel free to ask questions or submit links on Tumblr, Twitter, or by email.
The Structure of Turbulence
Though they may appear random at first glance, turbulent flows do possess structure. The video above shows a numerical simulation of a mixing layer, a flow in which two adjacent regions of fluid move with different velocities. The upper third of the frame shows a top view, and the bottom frame shows a side view, in which the upper fluid layer moves faster than the lower one. The difference in velocities creates shear which quickly drives the mixing layer into turbulence. But watch the chaos carefully, and your eye will pick out vortices rolling clockwise in the largest scales of the mixing layer. These features are known as coherent structures, and they are key to current efforts to understand and model turbulent flows. (Video credit: A. McMullan)

Bubble Vortices
Vortices appear in scales both large and small, from your shower and the flap of an insect’s wing to cyclones and massive storms on other planets. Especially with these large-scale vortices, it can be difficult to understand the factors that affect their trajectories and intensities over time. Here researchers have studied the vortices produced on a heated half bubble for clues as to their long-term behavior. Heating the base of the bubble creates large thermal plumes which rise and generate large vortices, like the one seen above, on the bubble’s surface. Researchers observed the behavior of the vortices with and without rotation of the bubble. They found that rotating bubbles favored vortices near the polar latitudes of the bubble, just as planets like the Earth and Saturn have long-lived polar vortices. They also found that the intensification of both bubble vortices and hurricanes was reasonably captured by a single time constant, which may lead to better predictions of storm behaviors. Their latest paper is freely available here. (Image credit: H. Kellay et al.; research credit: T. Meuel et al.; via io9)

Controlling Supersonic Flight
The forces on an object in flight come from the distribution of pressure on the surface. To alter an object’s trajectory, one has to shift the pressure distribution. On subsonic and transonic aircraft, this is usually done with control surfaces like an aileron, but at supersonic speeds this can require a lot of force. The schlieren images above show an alternative approach in which a plasma actuator near the nosetip generates asymmetric forces on the cone. The actuator discharges plasma at t=0, and flow is from left to right. In the first image, the bubble of plasma is expanding on the upper side of the cone, disrupting the nearby shock wave. Over time, it moves downstream, carrying its disruption with it. The asymmetric effect of the plasma causes uneven pressures on either side of the cone that can be triggered in order to turn it in flight. (Photo credit: P. Gnemmi and C. Rey)
Measuring Wind Turbines with Snowfall
One of the challenges in large-scale wind energy is that operating wind turbines do not behave exactly as predicted by simulation or wind tunnel experiments. To determine where our models and small-scale experiments are lacking, it’s useful to make measurements using a full-scale working turbine, but making quantitative measurements in such a large-scale, uncontrolled environment is very difficult. Here researchers have used natural snowfall as seeding particles for flow visualization. The regular gaps in the flow are vortices shed from the tip of the passing turbine blades. With a searchlight illuminating a 36 m x 36 m slice of the flow behind a wind turbine, the engineers performed particle image velocimetry, obtaining velocity measurements in that region that could then be correlated to the wind turbine’s power output. Such in situ measurements will help researchers improve wind turbine performance. (Video credit: J. Hong et al.)
Air Pressure Affects Splashes
When a drop falls on a dry surface, our intuition tells us it will splash, breaking up into many smaller droplets. Yet this is not always the case. The splashing of a droplet depends on many factors, including surface roughness, viscosity, drop size, and–strangely enough–air pressure. It turns out there is a threshold air pressure below which splashing is suppressed. Instead, a drop will spread and flatten without breaking up, as shown in the video above. For contrast, here is the same fluid splashing at atmospheric pressure. This splash suppression at low pressures is observed for both low and high viscosity fluids. Although the mechanism by which gases affect splashing is still under investigation, measurements show that no significant air layer exists under the spreading droplet except near the very edges. This suggests that the splash mechanism depends on how the spreading liquid encroaches on the surrounding gas. (Video credit: S. Nagel et al.; research credit: M. Driscoll et al.)


