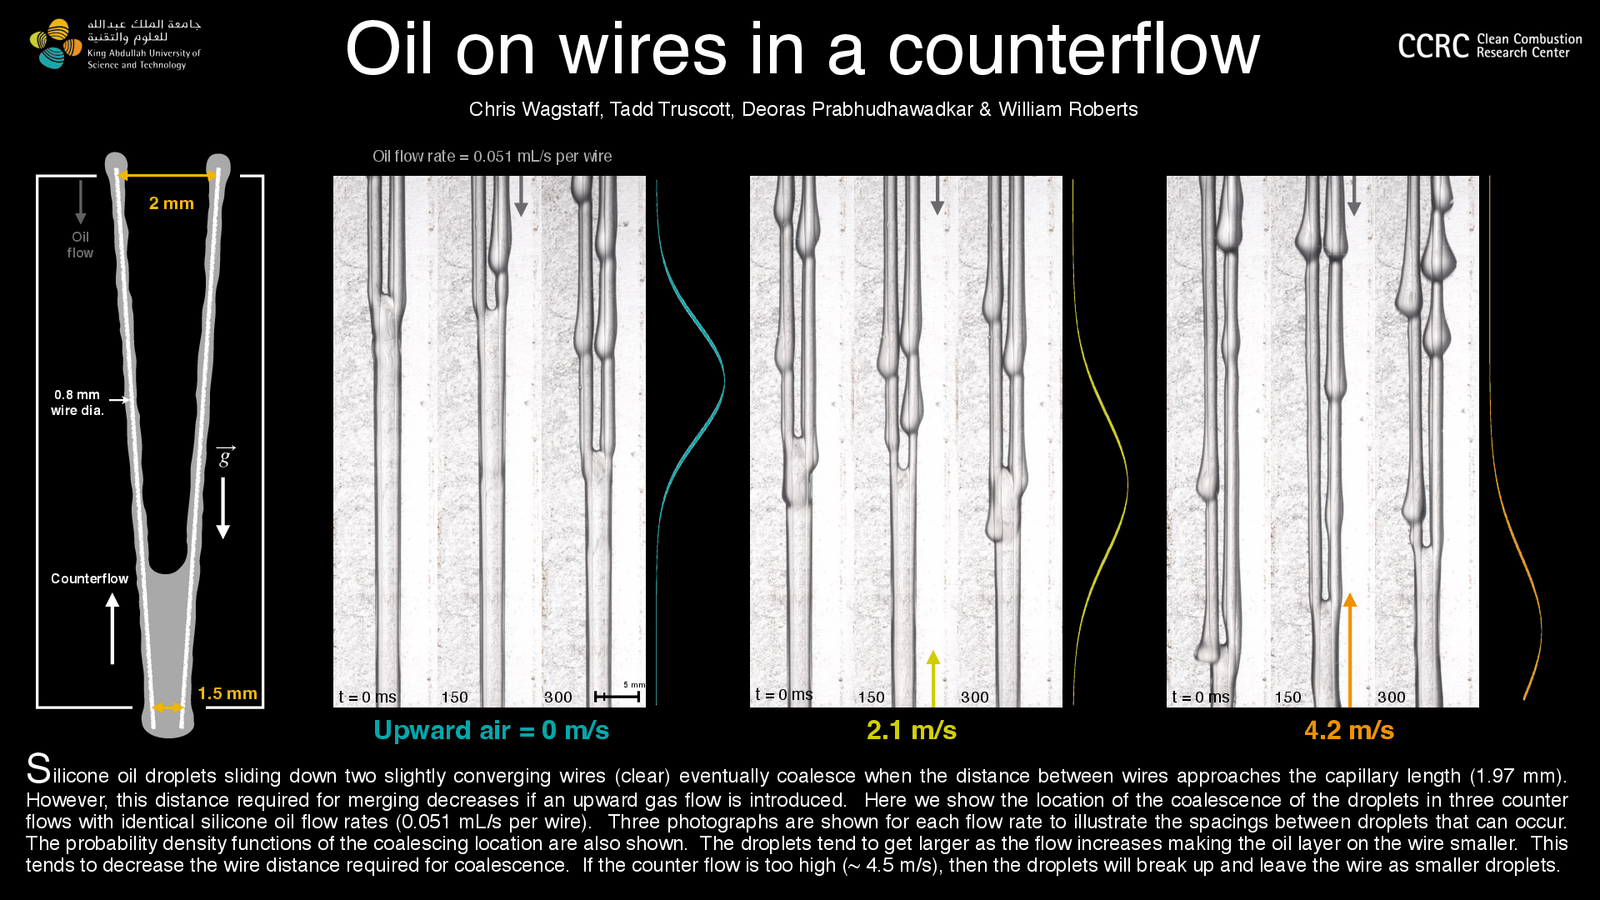
As oil slides down two slowly converging wires, the droplets will merge into a sheet that stretches between both wires. When this happens can vary somewhat but occurs somewhere around the liquid’s capillary length.
In the poster above, the leftmost image (not the illustration) shows three possible merger points. To the right of the image, is a teal curve; this is a probability density function. Essentially, this curve shows where the merger is most likely to occur. The peak of the curve corresponds to the most probable point of merger.
The following two composite images show the same system — same oil flow rate, same wire spacing — with gas blowing upward along the wires. As the gas’s flow rate increase, the oil drops get larger, making the oil films thinner. The result? The wires have to get closer to one another before the oil merges. That’s reflected in the yellow and orange probability density functions, which have peaks further along the wires than the no-gas-flow case. (Image credit: C. Wagstaff et al.)
Leave a Reply