Tag: planetary boundary layer

  • Inside the Canopy

    Inside the Canopy

    If you’ve ever gone into the woods on a windy day, you know that conditions there are drastically different than in the open. To blowing wind, trees of different sizes act like enormous roughness that disturbs the flow. Inside the canopy, flows can become incredibly complicated and many of the common techniques used by researchers no longer hold. 

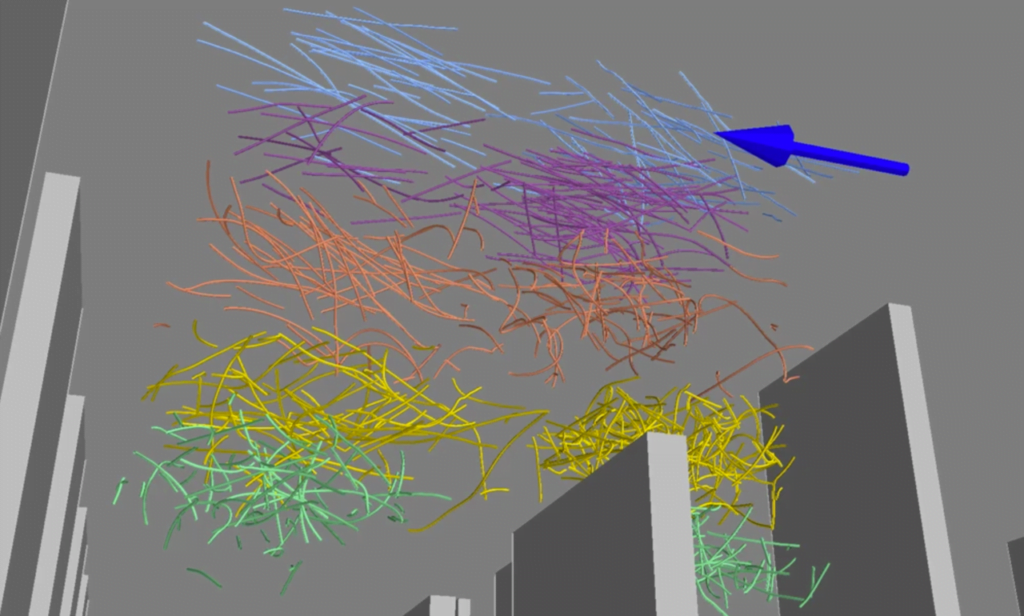
    You can get a sense for this complexity with the second image above, which visualizes data from a wind tunnel experiment. The gray blocks represent roughness elements – the trees of this wind-tunnel-scale forest – and the large, blue arrow shows the direction of the flow. The thin colored lines show the paths taken by particles in the flow. The lines’ colors indicate what height the trajectory began at. 

    Notice how the blue and purple lines are relatively straight and oriented in the direction of the flow. This indicates that the flow here is relatively steady and uncomplicated. At the lower heights, though, especially in the green and yellow regions, the pathlines are far more twisted and complex. The flow here is turbulent, and the particles’ trajectories don’t necessarily correlate at all to the winds higher up. (Image credit: T. Japyassu and R. Shnapp et al.; research credit: R. Shnapp et al.; submitted  by Ron S.)

  • Featured Video Play Icon

    City Winds Simulated

    Anyone who has spent much time in an urban environment is familiar with the gusty turbulence that can be generated by steady winds interacting with tall buildings. To the atmospheric boundary layer–the first few hundred meters of atmosphere just above the ground–cities, forests, and other terrain changes act like sudden patches of roughness that disturb the flow and generate turbulence. The video above shows a numerical simulation of flow over an urban environment. The incoming flow off the ocean is relatively calm due to the smoothness of the water. But the roughness of an artificial island just off the coast acts like a trip, creating a new and more turbulent boundary layer within the atmospheric boundary layer. It’s this growing internal boundary layer whose turbulence we see visualized in greens and reds. (Video credit: H. Knoop et al.)

  • Featured Video Play Icon

    Flow in Urban Areas

    While we typically think about boundary layers as a small region near the surface of an object–be it airplane, golf ball, or engine wall–boundary layers can be enormous, like the planetary boundary layer, the part of the atmosphere directly affected by the earth’s surface. Shown above is a flow visualization of the boundary layer in an urban area; note the models of buildings. In these atmospheric boundary layers, buildings, trees, and even mountains act like a random rough surface over which the air moves. This roughness drives the fluid to turbulent motion, clear here from the unsteadiness and intermittency of the boundary layer as well as the large variation in scale between the largest and smallest eddies and whorls. In the atmosphere, the difference in scale between the largest and smallest eddies can vary more than five orders of magnitude.

  • Cloud Streets

    Cloud Streets

    Cloud streets–long rows of counter-rotating air parallel to the ground in the planetary boundary layer–are thought to form as a result of cold air blowing over warm waters while caught beneath a warmer layer of air, a temperature inversion. As moisture evaporates from the warmer water, it creates thermal updrafts that rise through the atmosphere until they hit the temperature inversion. With nowhere to go, the warmer air tends to lose its heat to the surroundings and sink back down, creating a roll-like convective cell. (Photo credits: NASA Terra, NASA Aqua, and Tatiana Gerus)