Tag: sports

  • PyeongChang 2018: Ice-Making

    PyeongChang 2018: Ice-Making

    When it comes to winter sports, not all ice is created equal. Every discipline has its own standards for the ideal temperature and density of ice, which makes venue construction and maintenance a special challenge. Figure skating, for example, requires softer ice to cushion athletes’ landings, whereas short-track speed skating values dense, smooth ice for racing. The Gangneung Ice Arena hosts both and can transition between them in under 3 hours. Gangneung Oval hosts long-track speed skating and makes its ice layer by layer, spraying hot, purified water onto the rink. This builds up a particularly dense and therefore smooth ice. 

    The toughest sport in terms of ice conditions is curling, which requires a finely pebbled ice surface for the stones to slide on. Forming those tiny crystals on the ice sheet can only be done at precise temperature and humidity conditions. This is a particular challenge for Gangneung Curling Center due to its coastal location. To keep the temperature and humidity under control at full crowd capacity, officials even went so far as to replace all the lighting at the facility with LEDs! (Image credit: Pyeongchang 2018, 1, 2, 3)

  • PyeongChang 2018: Skeleton

    PyeongChang 2018: Skeleton

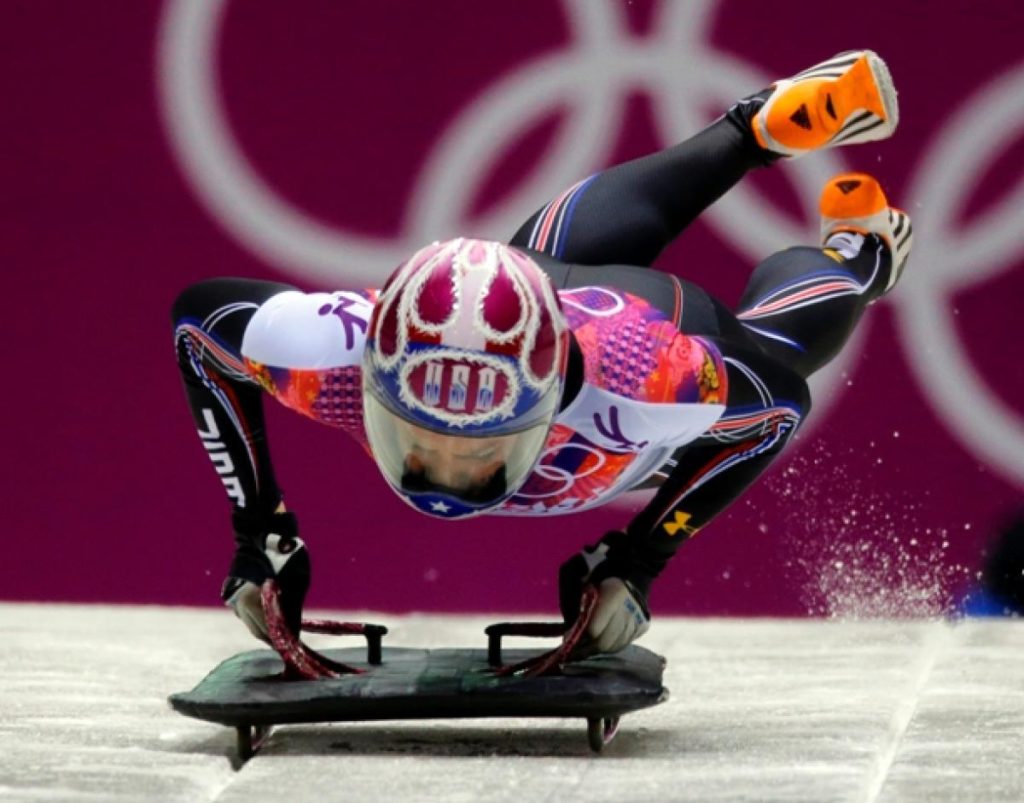
    Skeleton, the sliding event in which athletes race down an ice track head first, is a fast-paced and punishing sport. Skeleton racers can reach speeds of 125 kph (~80 mph) during their descents. This is a little slower than the feet-first luge, in part because the skeleton sled runs on circular bars rather than sharp runners. 

    Body positioning is key in the sport. It’s the athlete’s primary method of steering, and it controls how much drag slows them down. But skeleton runs are brutally taxing; athletes pull 4 or 5g in the turns – more than astronauts experience during a launch! All that jostling means athletes cannot stand more than about 3 trips down the track in a day. To practice positioning without the bone-jarring descent, athletes can work in a wind tunnel. While the wind tunnel provides the aerodynamic equivalent of their usual speed, athletes focus on holding their bodies in the most streamlined position. Some wind tunnels are even able to provide screens that let the athletes see their drag values in real-time, letting them adjust to learn what works best for them. (Image credit: N. Pisarenko/AP, Bromley Sports)

  • PyeongChang 2018: Ski Jumping

    PyeongChang 2018: Ski Jumping

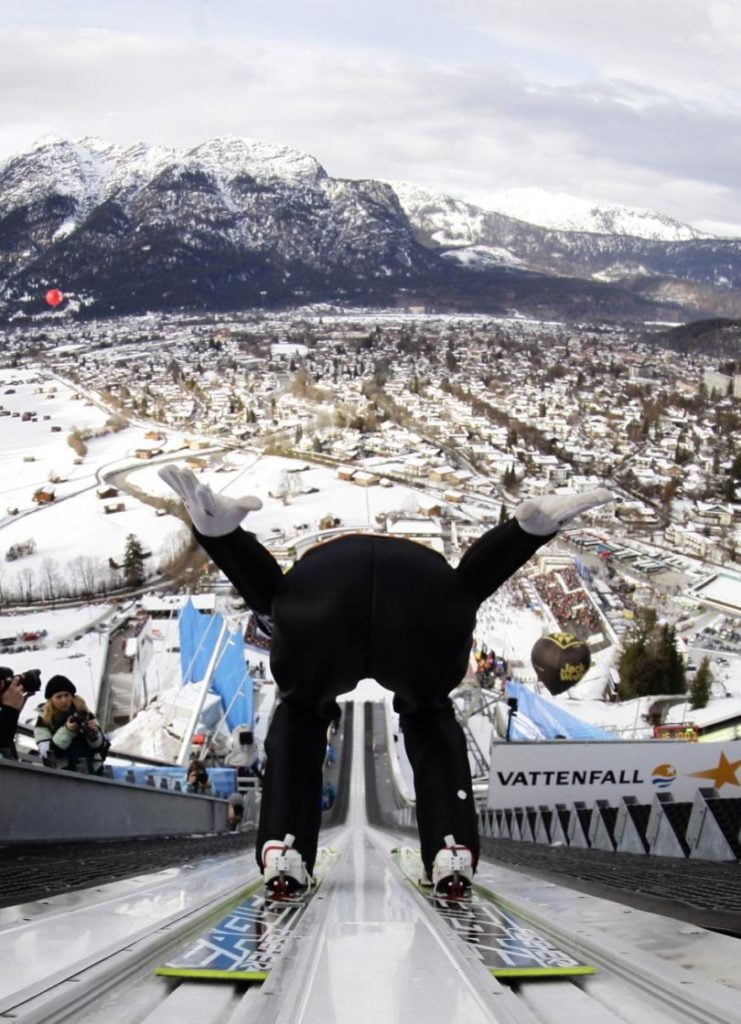
    No winter sport is more aerodynamically demanding than ski jumping. A jump consists of four parts: the in-run, take-off, flight, and landing. The in-run is where an athlete gains her speed, and to keep drag from slowing her down, she descends in a streamlined tuck that minimizes frontal area. The biggest aerodynamic challenge comes during flight, when the jumper wants to maximize lift while minimizing drag. The athlete spreads her skis in a V-shape and flattens her body, using her hands to adjust her flight. Flying the farthest requires careful management of forces while in the air. Wind plays a major role as well, with headwinds helping athletes fly farther. To compensate, scoring includes a wind factor calculated based on conditions for each jump. (Image credit: B. Pieper, Reuters/K. Pfaffenbach, PyeongChang 2018)

  • Reader Question: Drafting in Time Trials

    Reader Question: Drafting in Time Trials

    In a comment on this recent post regarding drafting advantages to a leader, reader fey-ruz asks:

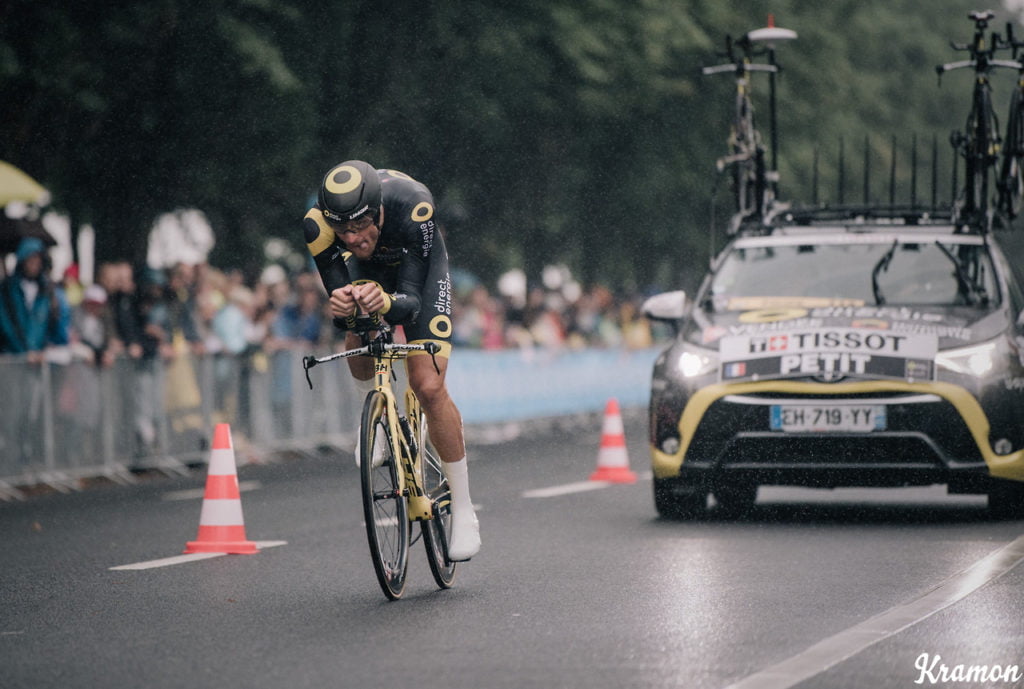
    in cycling, team follow cars are required to maintain a minimum distance from their riders during time trials for this very reason (although i imagine the effects in that context are much smaller and dependent on the conditions, esp the wind speed, direction, and strength). FYFD, is there a simple way to understand where this upstream influence comes from? or a specific term in the navier-stokes equations that it results from?

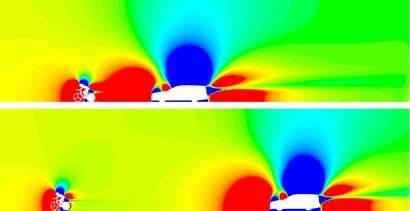
    Cars following riders during a time trial can actually make a huge difference! One study from a couple of years ago estimated that a car following a rider in a short (13.8 km) time trial could take 6 seconds off the rider’s time. The images up top show a simulation from that study with a car following at 5 meters versus 10 meters. The colors indicate the pressure field around the car and rider. Red is high pressure, blue is low pressure. Both the car and the rider have high pressure in front of them; you can think of this as a result of them pushing the air in front of them.

    A large part of the rider’s drag comes from the difference in pressure ahead and behind them. (For a look at flow around a cyclist that focuses on velocity instead, check out my video on cycling aerodynamics.) When a car drives close behind a cyclist, it’s essentially pushing air ahead of it and into the cyclist’s wake. This actually reduces the difference in pressure between the cyclist’s front and back sides, thereby reducing his drag. Because cars are large, they have an oversized effect in this regard, but having a motorbike or another rider nearby also helps the lead cyclist aerodynamically.

    As for the Navier-Stokes equation – this effect isn’t one that you can really pin down to a single term since it’s a consequence of the flow overall. (Image credits: TU Eindhoven; K. Ramon)

  • Cycling Skinsuits and Vortex Generators

    Cycling Skinsuits and Vortex Generators

    It didn’t take long for an aerodynamic controversy to crop up in this year’s Tour de France. At the 14km individual time trial, riders from Team Sky wore custom Castelli skinsuits with integrated dot-like patterns on their upper arms (shown above). By the next day, a sports scientist with a competing team cried foul play, claiming that these fabrics could have given Team Sky as much as 25 seconds’ advantage over other riders. The Sky team finished with 4 out of the top 10 places on the time trial, and their leader, three-time Tour winner Chris Froome, finished some 35 seconds ahead of his expected competitors for the yellow jersey.

    Vortex generators explained

    So how could a few dots make a measurable difference? These protrusions are vortex generators meant to modify flow around a cyclist. Humans are not aerodynamic and what typically happens when air flows over a cyclist’s arms is shown in the flow visualization above: the air follows the curve of the arm part way, then it separates from the body, leaving a region of recirculation that increases drag. Vortex generators can help prevent or delay that drag-inducing flow separation by adding extra energy and turbulence to the air near the arm’s surface. Because turbulent boundary layers can follow a curve longer before separating, this helps reduce the drag by reducing the recirculation zone.

    About that time savings

    Aerodynamically speaking, those vortex generators can make a difference, but the question is, how much? In his complaint, Grappe cites a 2016 paper by L. Brownlie et al. that wind-tunnel tested different vortex generator patterns for use in running apparel. The speeds tested included those relevant to cycling. The specific numbers Grappe quotes aren’t directly relevant, however:

    As noted above, race garments that contain VG provide reductions in Fd of between 3.7 and 6.8% compared to equivalent
    advanced race apparel developed for the 2012 London Olympics which in turn provided substantially lower drag than
    conventional race apparel.

    the effectiveness of 5, 10 and 15 cm wide strips of VG applied to each flank of a sleeveless singlet revealed that the 5 cm wide
    strips provided between 3.1 and 7.1% less Fd than the 10 cm wide strips and between 1.9 and 4.3% less Fd than the 15 cm wide
    strips.  

    Here Brownlie et al. are specifically describing the savings for running apparel, which uses vortex generators in very different places than you would on a cyclist. Note the second quote even refers to a sleeveless singlet, so the vortex generators measured are definitely not in the same place as these skinsuits!

    The bottom line

    I fully expect that vortex generators give a marginal aerodynamic edge, which is why Sky and other teams have already been using them in competition. But I hesitate to declare that the savings is as high as 5-7%, and I have no way to verify Grappe’s subsequent claims that this translates to 18-25 seconds in the time trial. Those are numbers he gives without citing what model is being used to translate drag gains into time.

    In the end, what is needed is clarification of the rules. As they stand, one rule seems to allow the skinsuits because the vortex generators are integrated into the fabric, whereas another states clothing is forbidden “to influence the performances of a rider such as reducing air resistance”. Those two stances seems contradictory, and, for now, the race officials’ verdict to allow the suits stands.

    If you want to learn more about aerodynamics and cycling, be sure to check out my latest FYFD video. (Image credits: B. Tessier/Reuters; Getty Images; L. Brownlie et al. 2009; h/t to W. Küper)

  • How Cycling Position Affects Aerodynamics

    How Cycling Position Affects Aerodynamics

    New FYFD video! How much does a rider’s position on the bike affect the drag they experience? To find out I teamed up with folks from the University of Colorado at Boulder and at SimScale to explore this topic using high-speed video, flow visualization, and computational fluid dynamics. 

    Check out the full video below, and if you need some more cycling science before the Tour de France gets rolling, you can find some of my previous cycling-related posts here. (Image and video credit: N. Sharp; CFD simulation – A. Arafat)

    ETA: Please note that the video contained in this post was sponsored by SimScale.

  • Featured Video Play Icon

    Rio 2016: Badminton

    Badminton is unusual among racquet sports because it does not use a sphere as its projectile. Instead players hit a shuttlecock, traditionally made from a cork ball and a skirt of goose feathers. Despite its unusual shape, the shuttlecock reaches some of the fastest speeds in sports – over 330 kph (200 mph)! The shuttlecock’s high-drag form quickly slows shots down but also gives the game very different trajectories compared to other racquet sports.

    It’s likely that, if you’ve played badminton yourself, you’ve played with a shuttlecock that has a plastic skirt rather than a feathered one. These synthetic shuttlecocks are cheaper and more durable, but they also have different drag characteristics than their feathered cousins. At low speeds, synthetic shuttlecocks have more drag than feathered ones, but at high speeds, the opposite is true. This is because the plastic skirt deforms more easily than the feathers, causing a synthetic shuttlecock’s skirt to collapse into a shape with less drag. (Video credit: Science Friday; research credit: F. Alam et al.)

    Join us throughout the Rio Olympics for more fluid dynamics in sports. If you love FYFD, please help support the site!

  • Rio 2016: Sailing and Rule 42

    Rio 2016: Sailing and Rule 42

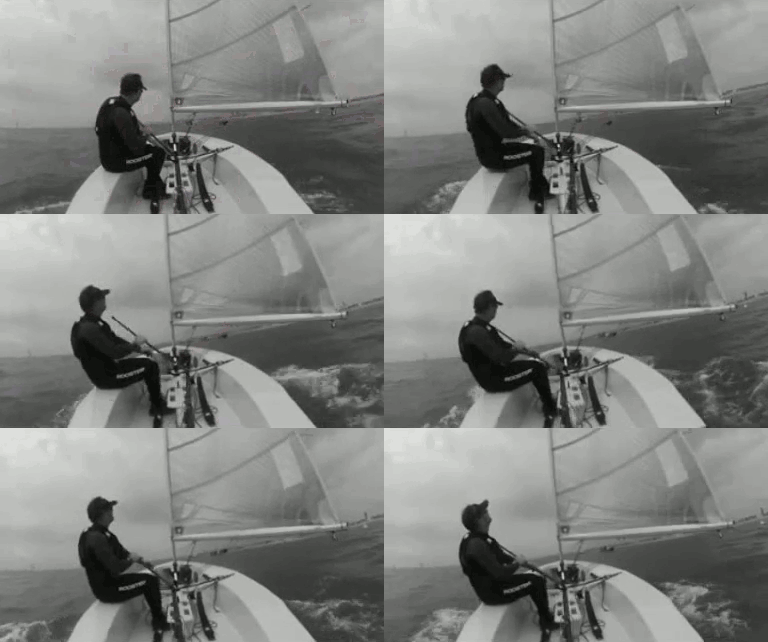
    If you watch some of the sailing in Rio, you may hear commentators mention sailors being penalized for breaking Rule 42. Broadly speaking, Rule 42 says that sailors can’t use their body to propel the boat. While it seems like a little rocking couldn’t make much difference, it turns out events have these rules for good reason.

    One way to break Rule 42 is to perform sail flicking, demonstrated in the animation above. The sailor uses his or her body weight to roll the boat slightly, which causes the sail to flick. Aerodynamically speaking, we’d call this motion heaving. On the flexible sail, this unsteady motion decreases drag, allowing the boat to go faster. Done with the right frequency and amplitude, sail flicking actually makes the sail’s drag become negative, thereby creating thrust!

    The bottom image shows a visualization of the wake of a normal sail (left) and a sail being flicked (right). Both sails shed vortices in the downstream direction, but the flicked sail has much stronger vortices, indicated by the darker colors. In addition to giving a sailor an illegal boost, sail flicking creates more difficult, turbulent conditions for any competitors downstream, so it’s restricted in many (but not all) sailing events. (Image credits: AP Photos; Reuters; National Solo, source; research and flow diagram credit: R. Schutt and C. Williamson, pdf)

    Join us throughout the Rio Olympics for more fluid dynamics in sports. If you love FYFD, please help support the site!

  • Rio 2016: Long Jump

    Rio 2016: Long Jump

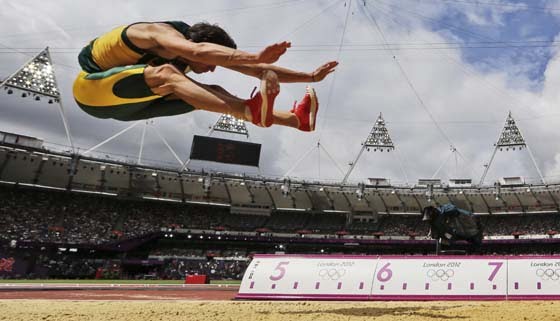
    Long jump, like many track and field events, is affected by fluid dynamics in subtle ways. Both wind speed and altitude can modify a jumper’s performance – first, by changing the maximum speed they reach in their sprint, and second, through aerodynamic drag while in flight. Air resistance accounts for roughly 10% of a sprinter’s energy expenditure. A slight tailwind gives an athlete a minor boost in speed that can translate into a more significant increase in jump distance. On the other hand, though, a headwind of the same magnitude has an even stronger negative effect on performance.

    The other factor, altitude, comes into play through air density. The official Olympic record for the long jump was set by Bob Beamon in the 1968 Mexico City Games. The high altitude of Mexico City results in an air density that’s only 75% of that at sea level. That’s tougher on athletes in terms of oxygen levels, but it’s a big reduction in the overall drag they face, resulting in both a higher sprinting speed and less aerial drag. This is part of why Beamon’s jump stood as a world record for well over 20 years! (Image credits: AP Photo; AFP/GettyImages; Reuters)

    Previously: Can dimpled shoes help runners?; the unusual aerodynamics of the javelinthe physics of the discus

    Join us throughout the Rio Olympics for more fluid dynamics in sports. If you love FYFD, please help support the site!

  • Rio 2016: Synchro Swimming and Water Polo

    Rio 2016: Synchro Swimming and Water Polo

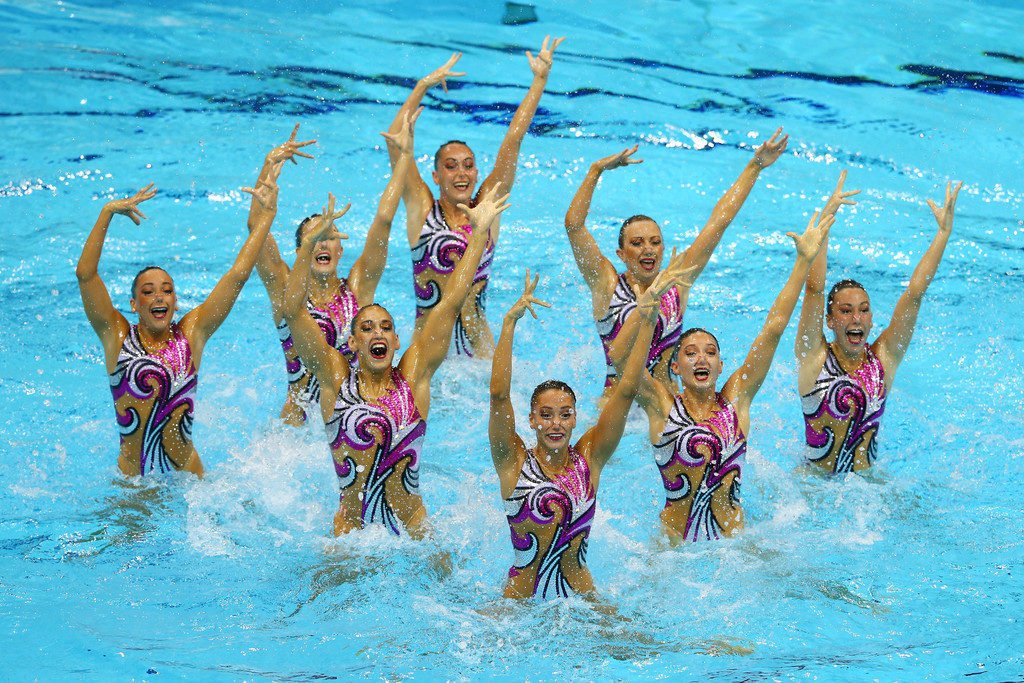
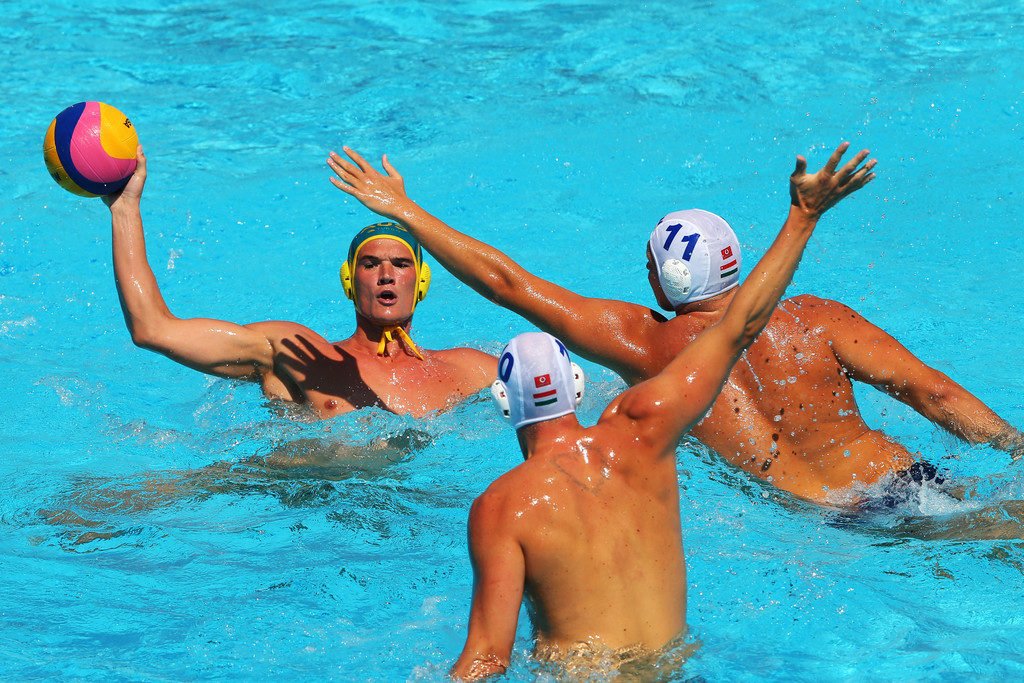
    Both synchronized swimming and water polo require competitors to hold themselves stable above the water’s surface without touching the pool’s bottom. One of the basic techniques for doing so in both sports is known as the eggbeater kick, shown above. The eggbeater kick is very similar to the motion for the breaststroke’s kick, but it’s performed upright and with alternating leg motions, sweeping a clockwise circle with the left leg and a counterclockwise one with the right.

    A swimmer typically stays afloat due to a buoyant force equal to the weight of the volume of water the swimmer displaces. Rising further out the water means reducing the buoyant force, so the swimmer must generate other forces to counter their weight. The eggbeater kick does this two ways. First, as the swimmer sweeps their foot around, it acts like a hydrofoil, generating lift that holds the swimmer up. Second, other parts of the kick cycle force water downward, which, by Newton’s third law, pushes the swimmer up. 

    Keeping a wide stance and sweeping the legs alternately allows the athlete to balance the horizontal forces their motions create while keeping the upward forces generated relatively constant. This gives them a stable, arms-free platform that’s a foundation for everything else their sport requires.  (Image credits: GettyImages; The Studio WLV, source)

    Previously: How buoyancy helps swimmers

    Join us throughout the Rio Olympics for more fluid dynamics in sports. If you love FYFD, please help support the site!