Cooking is something we think of as a one-way process. You add heat to food, it changes forms, and there’s undoing that. But that process is less one-directional than we thought, at least in some cases. Take boiling an egg. When you add heat to egg whites, it breaks down bonds between the folded proteins and lets those proteins build more bonds with other sections of proteins, eventually solidifying into a seemingly unbreakable mess. You can’t break those bonds by adding or removing thermal energy, but you can shake the proteins apart and refold them into their original shapes.
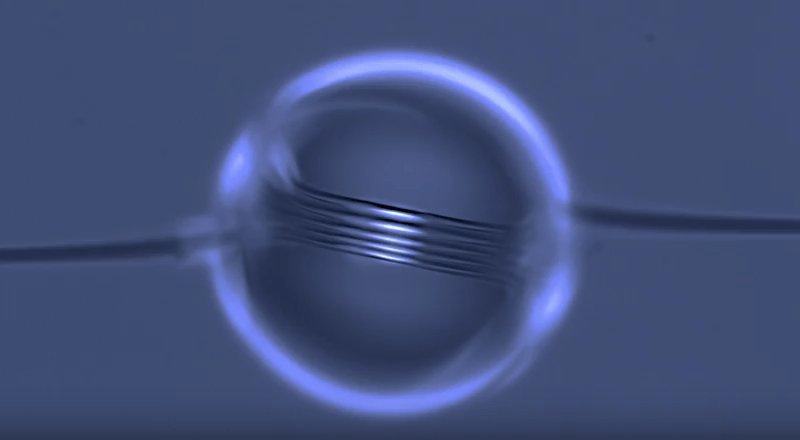
Researchers accomplish this by putting the boiled egg whites in a solution of water and urea and spinning them. When they spin the fluid mixture, the fluid near the wall spins faster than the fluid in the center of the vial, which creates shear stress. That shear stress helps untangle the proteins and reform them into their original shape–thereby unboiling the egg white. Now you definitely don’t want to eat the results – urea is, of course, a component of urine – but it does demonstrate that fluid dynamics can be used to reverse chemical processes we thought were irreversible. And that surprising discovery nabbed the researchers an Ig Nobel Prize in 2015. (Video credit: TedEd/E. Nelson; research credit: T. Yuan et al.)