Tag: schlieren photography

  • Shock Waves in Flight

    Shock Waves in Flight

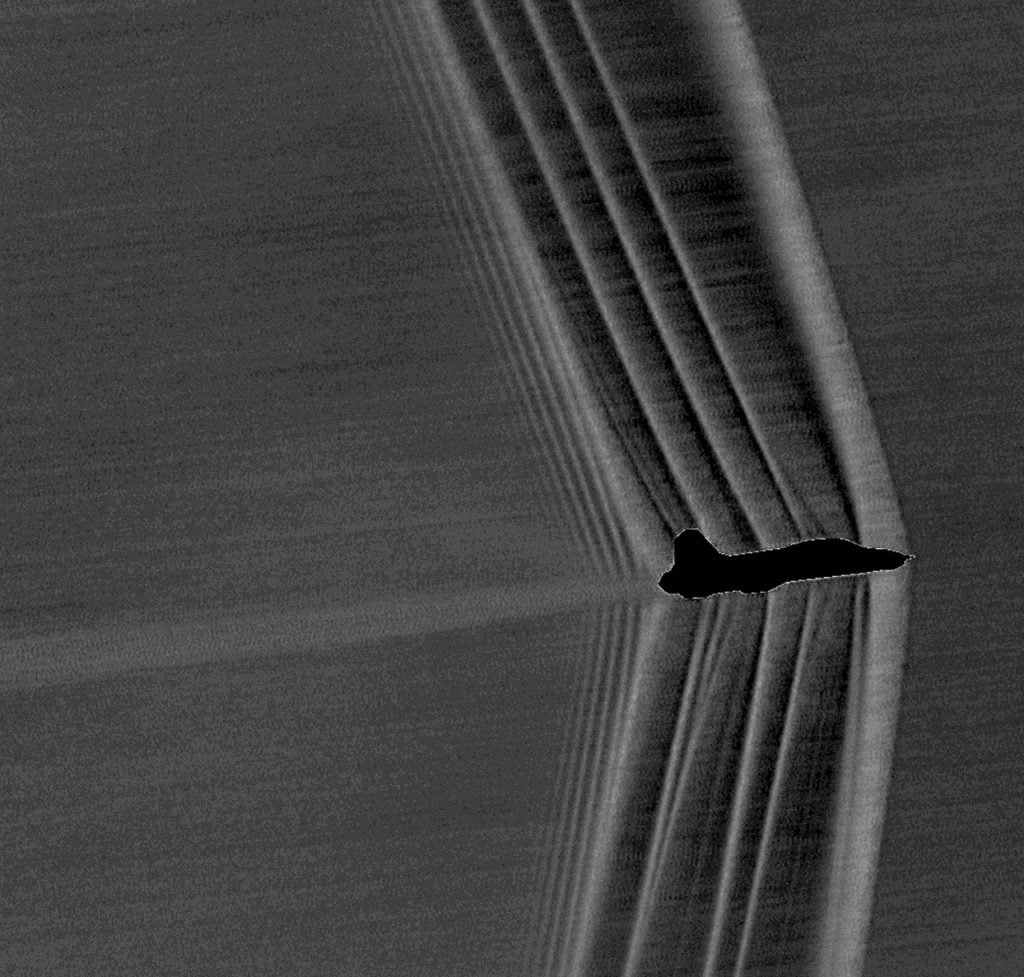
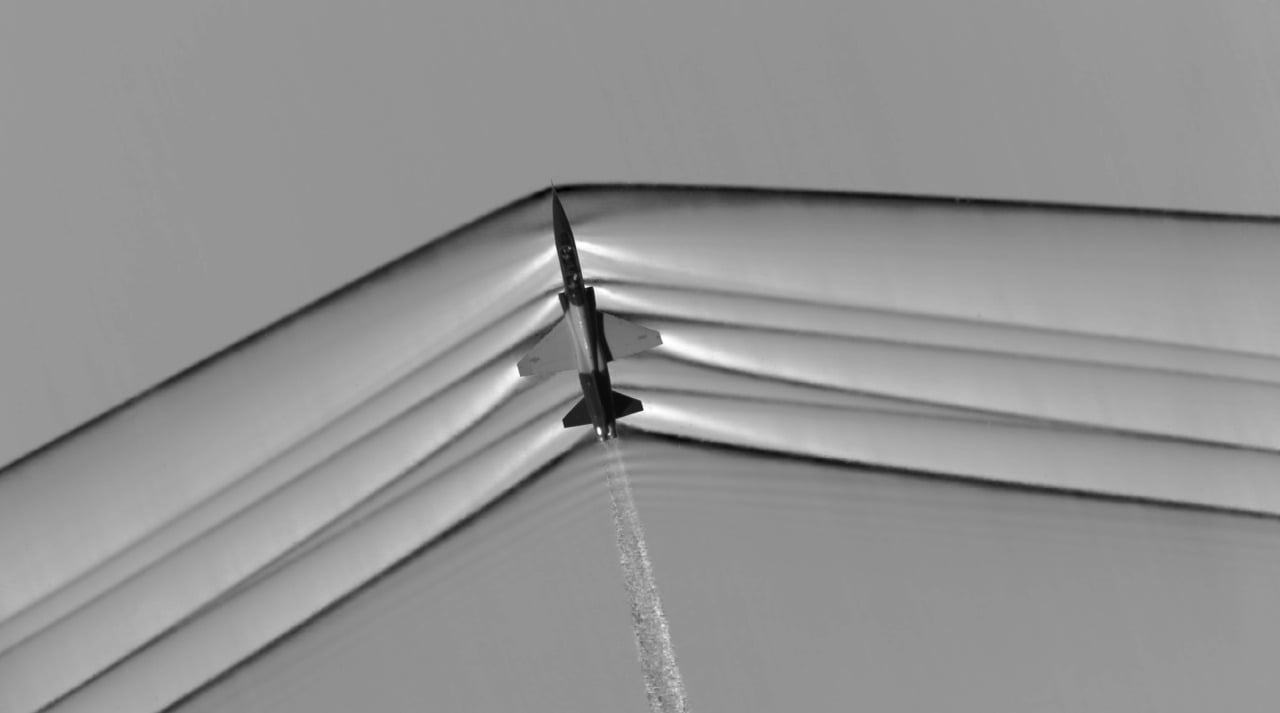
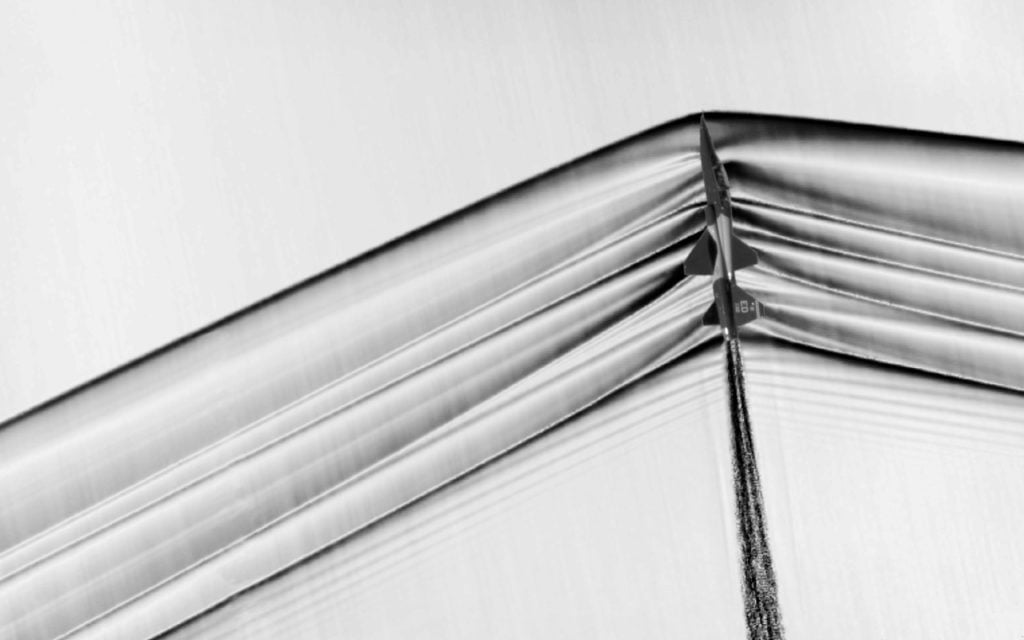
    This week NASA released two new images of the shock waves surrounding T-38C jets in free flight. They’re the result of NASA’s new adaptations of the schlieren photography technique, which has let scientists visualize shock waves (in the lab, at least) for more than a century. To celebrate, I thought it would be fun to demonstrate some of the data engineers can extract from images like the one above. So I’m going to show you how to calculate how fast this plane was flying!

    Shock waves depend a lot on geometry. This is not too surprising, really, since shock waves are nature’s way of quickly turning the air because there’s an object in the way. This leads to a very powerful observation, though: the angle of a shock wave depends on the geometry of the object and the Mach number of the flow. (The Mach number is the ratio of an object’s speed to the local speed of sound, so an object moving at Mach 1 is moving at the speed of sound.)

    The reverse observation is also true: if we can measure the angle of a shock wave from a known geometry, then we can calculate the Mach number. Now, I don’t have any special information about the geometry of a T-38, so most of the shock waves in this picture can’t tell me much quantitatively.

    But, it turns out, I don’t need to know anything about the geometry of the plane to figure out its Mach number. That’s because that very first shock wave over on the right is coming off a sharp probe mounted over the airplane’s nose. The probe is sharp enough, in fact, that I can treat it as though it’s a tiny point disturbance. That means that rightmost shock wave is a special kind of shock known as a Mach wave, and its geometry depends solely on the Mach number. It’s a pretty simple equation, too:

    image

    So, all I have to do is fire up some software like GIMP or ImageJ and estimate the angle of that first shock wave.

    image

    I came up with an estimate of about 77 degrees for the shock wave angle, which gives Mach 1.026 for the plane’s speed. Keep in mind that a) I’m using a grainy photo; and b) I have no information about the plane’s orientation relative to the camera. Nevertheless, NASA’s caption reports that this plane was moving at Mach 1.05 in the picture. My quick and dirty estimate is only off by 2%!

    Of course, engineers are interested in a lot more than estimating an aircraft’s speed from these photos. With a little more geometry information, they can gather a lot of useful data from these images. One of the goals for the new photography technique is to help study new aircraft designs that generate weaker shock waves and quieter sonic booms. (Original images: NASA)

  • Ignition

    Ignition

    Shown here are the first instants after a bubble full of methane gas is ignited via laser. Using the schlieren optical method and a high-speed camera, scientists recorded the deflagration at 10,000 frames per second. Because schlieren imaging is very sensitive to small changes in density, we see not only the expanding flame front as the methane ignites but also the subtle waviness of the methane expanding into the surrounding air as the bubble bursts. (For comparison, check out what bursting a water balloon looks like at high-speed.) Be sure to head over to ScienceTake for the full schlieren video, and also check out this award-winning video of a match lighting made by the same researcher.  (Image credit: V. Miller et. al.; full video: The New York Times; submitted by Rebecca M.)

    ETA: An earlier version of this post mistakenly said the demo used a balloon full of methane rather than a bubble. Thanks to jump-first-think-later for the correction.

  • Shock Waves in Flight

    Shock Waves in Flight

    Schlieren optical systems have been used to visualize shock waves in labs for more than a century, but the technique did not translate well to photographing shock structures outside the lab. But now NASA’s Armstrong Research Center and Ames Research Center have developed a method that allows them to capture highly-detailed images of the shock waves around airplanes while they are flying. This is incredible stuff. Be sure to check out the high-resolution versions on this page, along with more description of the coordination necessary to pull off the photos.

    The light and dark lines you see emanating from the airplane are places with strong density gradients. The dark lines are mostly shock waves, with the strongest shock waves appearing black due to the large change in air density. Many of the light streaks are expansion fans, areas where the density and pressure drop as air speeds up.

    The goal of this research is to better understand shock wave structures around supersonic planes in order to reduce the noise supersonic aircraft cause when flying overhead. As you can see in the photos, the shock waves at the nose and tail of the aircraft persist far away from the aircraft; these are what cause the twin sonic boom heard when the plane flies by. (Photo credit: NASA; via J. Hertzberg)

  • Testing a Supersonic Car

    Testing a Supersonic Car

    How do you test a supersonic car like the Bloodhound SSC in a wind tunnel? With free-flying objects like airplanes, wind tunnel testing is relatively straightforward. Mounting a stationary model in a supersonic flow gives an equivalent flow-field to that object flying through still air at supersonic speeds. The same does not hold true for the supersonic car, though, because you need to account for the effect of the ground on airflow. One option is to build a moving wall in the wind tunnel. For low-speed applications, this is feasible but incredibly complicated and very expensive. For supersonic speeds, it’s impossible. You could achieve the same moving-wall effect at supersonic speeds with a rocket sled, but that is also expensive and difficult to fit in most experimental facilities. The simplest solution is the one you see above – build two models and mount them belly-to-belly. Reflecting the models makes the plane of symmetry a stagnation plane, which, fluid dynamically speaking, acts like an imaginary ground plane relative to the model. For more on the project and the technique, check out this article.  (Photo credit: B. Evans; via ThinkFLIP; submitted by G. Doig)

  • Featured Video Play Icon

    Simplified Schlieren Set-up

    Schlieren photography offers a glimpse into flows that are usually invisible to the human eye. With a relatively simple set-up–a light source, collimating mirror(s), and a razor blade–it becomes possible to see differences in density. The technique lets one visualize temperature-driven flows like the buoyant convection from a flame or other heat source, and it can also be used to visualize shock waves and sound. The video above has several neat schlieren demos, including some non-air examples using hydrogen (lighter than air) and sulfur hexafluoride (denser than air), both of which are transparent to the naked eye.  (Video credit: Harvard University, via Jennifer Ouellette)

  • Sound Interactions

    Sound Interactions

    Sound waves often interact with many objects before we hear them. Understanding and controlling those interactions is a major part of acoustic engineering. The animations above show shock waves–sound–from a trumpet interacting with different objects. The sound is made visible using the schlieren optical technique, allowing us to observe the reflection, absorption, and transmission of sound as it hits different surfaces. Fiberboard, for example, is highly reflective, redirecting the sound waves along a new path without a lot of damping. In contrast, the metal grid is only weakly reflective and a small portion of the incoming sound wave is transmitted through the grid. To see more examples, check out the full video, and, if you want to learn more about acoustics, check out Listen To This Noise.  (Image credits: C. Echeverria et al., source video)

  • Featured Video Play Icon

    The Hidden Complexities of the Simple Match

    Striking a match and blowing it out seems rather simple to the naked eye. But with high-speed video and schlieren photography, the act takes on new complexity. Schlieren photography is an optical technique that is incredibly sensitive to changes in density, which makes it a prime choice for visualizing flows with temperatures variations or shock waves. Here it shows the hot gases generated as the match is lit. Once the match ignites, the flow calms somewhat into a gently rising plume of exhaust and hot air. When someone enters the frame to blow out the match, the frame rate increases to capture what happens next. The flow field around the match becomes very complex as the air and flame interact. The range of length scales in the flow increases, from scales of several centimeters down to those less than a millimeter. This complexity and range of sizes  is a hallmark of turbulence. (Video credit: V. Miller et al.)

  • Transonic Flow

    Transonic Flow

    In the transonic speed regime the overall speed of an airplane is less than Mach 1 but some parts of the flow around the aircraft break the speed of sound. The photo above shows a schlieren photograph of flow over an airfoil at transonic speeds. The nearly vertical lines are shock waves on the upper and lower surfaces of the airfoil. Although the freestream speed in the tunnel is less than Mach 1 upstream of the airfoil, air accelerates over the curved surface of airfoil and locally exceeds the speed of sound. When that supersonic flow cannot be sustained, a shock wave occurs; flow to the right of the shock wave is once again subsonic. It’s also worth noting the bright white turbulent flow along the upper surface of the airfoil after the shock. This is the boundary layer, which can often separate from the wing in transonic flows, causing a marked increase in drag and decrease in lift. Most commercial airliners operate at transonic Mach numbers and their geometry is specifically designed to mitigate some of the challenges of this speed regime.  (Image credit: NASA; via D. Baals and W. Corliss)

  • Featured Video Play Icon

    Lighting a Match

    The schlieren optical technique is ideal for visualizing differences in fluid density and is an important tool for revealing flows humans cannot see with their naked eyes. In this high speed video, a professor lights a match. The initial strike generates friction and heat sufficient to convert some of the red phosphorus in the match head to its more volatile white phosphorus form. We see this in the schlieren as the cloud-like burst in the first several seconds. The heat from the phosphorus combustion ignites the sulfur fuel and potassium chlorate oxidizer in the match head to create a more sustained flame. During this period, wavy, smoke-like whorls of hot air rise from around the flame as buoyancy takes over. The upward movement of hot air draws in cooler air from the surroundings, providing the flame with an ongoing source of oxygen and allowing it to grow.  (Video credit: RMIT University)

  • Featured Video Play Icon

    May the Fourth Be With You

    It only seems appropriate to share this little bit of schlieren photography today. May the Fourth be with you all. (Video credit: M. Hargather and J. Miller)