Recently, NASA Goddard released a visualization of aerosols in the Atlantic region. The simulation uses real data from satellite imagery taken between August and October 2017 to seed a simulation of atmospheric physics. The color scales in the visualization show concentrations of three major aerosol particles: smoke (gray), sea salt (blue), and dust (brown). One of the interesting outcomes of the simulation is a visualization of the fall Atlantic hurricane season. The high winds from hurricanes help pick up sea salt from the ocean surface and throw it high in the atmosphere, making the hurricanes visible here. Fires in the western United States provide most of the smoke aerosols, whereas dust comes mostly from the Sahara. Tiny aerosol particles serve as a major nucleation source for water droplets, affecting both cloud formation and rainfall. With simulations like these, scientists hope to better understand how aerosols move in the atmosphere and how they affect our weather. (Image credit: NASA Goddard Research Center, source; submitted by Paul vdB)
Tag: flow visualization

Microfluidic Chips in Action
Earlier this year, The Lutetium Project explored how microfluidic circuits are made, and now they are back with the conclusion of their microfluidic adventures. This video explores how microfluidic chips are used and how microscale fluid dynamics relates to other topics in the field. Because these techniques allow researchers very fine control over droplets, there are many chemical and biological possibilities for microfluidic experiments, some of which are shown in the video. Microfluidics in medicine are also already more common than you may think. For example, test strips used by diabetic patients to measure their blood glucose levels are microfluidic circuits! (Video and image credit: The Lutetium Project; submitted by Guillaume D.)

Symmetric Wakes
Nature is full of remarkable patterns and moments of symmetry. This image shows the wake behind two rotating cylinders. Half of the cylinders are visible at the far left. The flow moves left to right. The cylinders are rotating at the same rate but in opposite directions, clockwise for the cylinder on top and counter-clockwise for the bottom one. At this speed relative to the freestream, there is a beautiful symmetry to the vortices in the wake, but the researchers found that even a slight deviation from this condition quickly destroyed the pattern. The flow is visualized here by introducing tiny hydrogen bubbles via electrolysis. The bubbles are small enough that their buoyancy has no appreciable effect. (Image credit: S. Kumar and B. Gonzalez)

Peering Between Particles


Turbulence is not the only way to mix fluids. Even a steady, laminar flow can be an effective mixer if geometry lends a hand. Above, two dyes, fluorescein (green) and rhodamine (red), are injected into a porous flow through packed spheres. The flow runs from bottom to top in both images. Seeing the flow in such a crowded geometry is challenging. Here researchers used spheres with an index of refraction that matches water – that helps them avoid refraction that would prevent them from looking through spheres to the flow on the other side. They also lit a narrow plane of the flow using a laser sheet to isolate it. Together, this allowed the researchers to track the mixing of the two initially separate streaks of dye as they randomly mix in the spaces between spheres. (Image and research credit: M. Kree and E. Villermaux)

Flow Inside Convection Cells
Looking at convective cells, it’s easy to think that they are still and unmoving. But when you add particles, their inner flow becomes obvious. Warm, light fluid moves up through the center of each cell, skims along the surface, and then sinks at the edges of the cell after losing its heat at the cooling surface. Below, the fluid moves back toward the cell center, getting warmer as it’s heated by the lower surface. Once it reaches the middle of the cell, it’s light enough to rise up and start the process again. Convective cells like these are typical in cooking – watch for them forming in your miso soup or hot chocolate – but they can also be found on the sun and even in situations without heating! (Image credit: G. Kelemen, source)

Rheoscopic Flow Vis
One of the great challenges in visualizing fluid flows is the freedom of movement. A fluid particle – meaning some tiny little bit of fluid we want to follow – is generally free to move in any direction and even change its shape (but not mass). This makes tracking all of those changes difficult, and it’s part of why there are so many different techniques for flow visualization. The technique an experimenter uses depends on the information they hope to get.
Often a researcher may want to know about fluid velocity in two or more directions, which can require multiple camera angles and more than one laser sheet illuminating the flow. An alternative to such a set-up is shown above. The injected fluid – known as a rheoscopic fluid – contains microscopic reflective particles, in this case mica, that are asymmetric in shape. Imagine a tiny rod, for example. By illuminating the rod from different directions with different colors of light, you can determine the particle’s orientation based on the color it reflects. Since the orientation of the particle depends on the surrounding flow, you can infer how the flow moves. (Image credit and submission: J. C. Straccia; research link: V. Bezuglyy et al.)

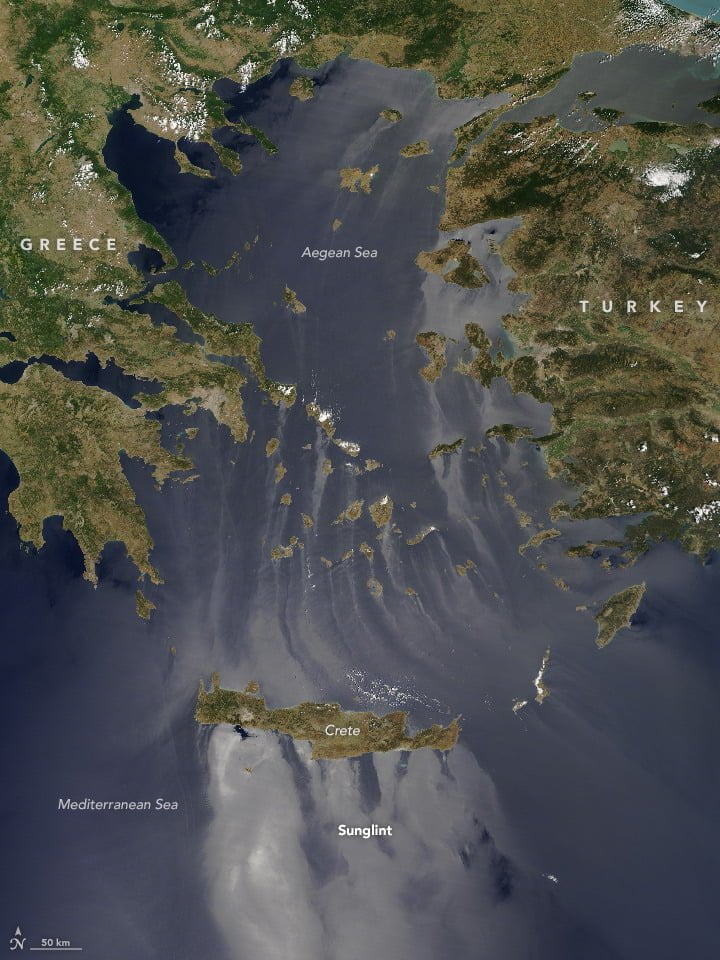
Sunglinting Seas
Sunlight reflecting off the Earth can reveal a remarkably rich picture of our planet’s activity. The silver-gray areas seen in this satellite image are sunglint, where lots of light is reflected back to space. Sunglint occurs in regions with very few waves; more waves – like in the bluer areas – mean more directions in which light can be scattered. The reason for these rough and smooth waters is atmospheric: the prevailing summer winds blow across the Aegean from the north. In open water, that wind drives up the waves, but rocky islands disrupt the flow, leaving “wind shadows” on their southern, leeward sides where the waves are smaller. (Image credit: J. Schmaltz; via NASA Earth Observatory)

Sunset Vortices
Often our atmosphere’s transparency masks the beautiful flows around us. This spectacular image shows a flight landing in Munich just after sunrise. Low-hanging clouds get sliced by the airplane’s passage and curl into its wake. The swirls are a result of the plane’s wingtip vortices, which wrap from the high-pressure underside of the wing toward the low-pressure upperside. The vortices stretch behind in the plane’s wake, creating turbulence that can be dangerous to following planes. In fact, these vortices are a major determining factor in the frequency of take-off and landing on a given runway. The larger a plane, the larger its wingtip vortices and the more time it takes for the turbulence of its passage to dissipate to a safe level for the next aircraft. (Image credit: T. Harsch; submitted by Larry S.)

Songs in Soap
There are many beautiful ways to visualize sound and music – Chris Stanford’s fantastic “Cymatics” music video comes to mind – but this is one I haven’t seen. This visualization uses a soap film on the end of an open tube with music playing from the other end. You can see the set-up here. The result is a fascinating interplay of acoustics, fluid dynamics, and optics. As sound travels through the tube, certain frequencies resonant, vibrating the soap film with a standing wave pattern (3:20). At the same time, interference between light waves reflecting off the front and back of the soap film create vibrant colors that show the film’s thickness and flow.
When the frequency and amplitude are just right, the sound excites counter-rotating vortex pairs in the film (0:05), mixing areas of different thicknesses. With just a single note, the vortex pairs appear and disappear, but with the music, their disappearance comes from the changing tones. Watching the patterns shift as the film drains and the black areas grow is pretty fascinating, but one of the coolest behaviors is how the acoustic interactions are actually able to replenish the draining film (2:15). Because the tube was dipped in soap solution, some fluid is still inside the tube, lining the walls. With the right acoustic forcing, that fresh fluid actually gets driven into the soap film, thickening it.
There are several more videos with different songs here – “Carmen Bizet” is particularly neat – as well as a short article summarizing the relevant physics for those who are interested. (Video and research credit: C. Gaulon et al.; more videos here)

Watching Flow Inside Rock
Flow through porous substances has been a major interest in fluid dynamics for the last hundred years because rocks are porous. For most of that period, we’ve used Darcy’s law to calculate how a fluid flows through pores in a rock. (Incidentally, it can also be used for determining the perfect length of time for dunking a cookie in milk.) Often, however, there is more than one fluid in a pore – for example, both a liquid and a gas could be trapped there. In that case, researchers made a few assumptions that allowed them to extend Darcy’s law for these multiphase situations. For a long time, that was the best anyone could do because it was impossible to observe what’s actually happening in the pores inside an actual rock.
Recently, however, scientists have begun observing these multiphase flows inside sandstone pores using x-ray imaging. They’re only able to take an image every 45 seconds or so, but even that is frequent enough to show that the flow is surprisingly unsteady. An example image is shown above. The colored areas show pores filled with nitrogen inside the rock. Brine is also being injected into the rock but not being shown. The colors indicate how connected the nitrogen-filled pores are to other pores nearby. Red areas are highly connected; blue have moderate connections; and green areas are smaller and have fewer connections. The network connections inside the rock change relatively rapidly, even with steady-state injection conditions. That varying connectivity implies that some of the injection energy is going into shifting interfaces around rather than actually moving the fluids through the pores. More work will be needed to unravel what’s really happening inside the porous network, but the results have far-reaching implications for understanding groundwater filtration, fossil fuel extraction, and, in the future, the possibility of carbon sequestration. (Image credit: C. Reynolds et al., source; submitted by Simon D.)