In 1915, the early days of submarine warfare, the RMS Lusitania was sunk off the coast of Ireland by a torpedo. Eyewitnesses reported a second, more powerful explosion just after the torpedo strike–possibly a boiler or powder explosion–that contributed to the ship sinking in only 18 minutes, resulting in nearly 1200 lives lost. Researchers at Lawrence Livermore National Laboratory have tackled the historic mystery, combining computational efforts with experimentation and historical research to reconstruct the physics of what happened. The full documentary airs tonight on the National Geographic Channel as “Dark Secrets of the Lusitania”. (submitted by Stephanie N)
Tag: experimental fluid dynamics

Martian Landing Physics

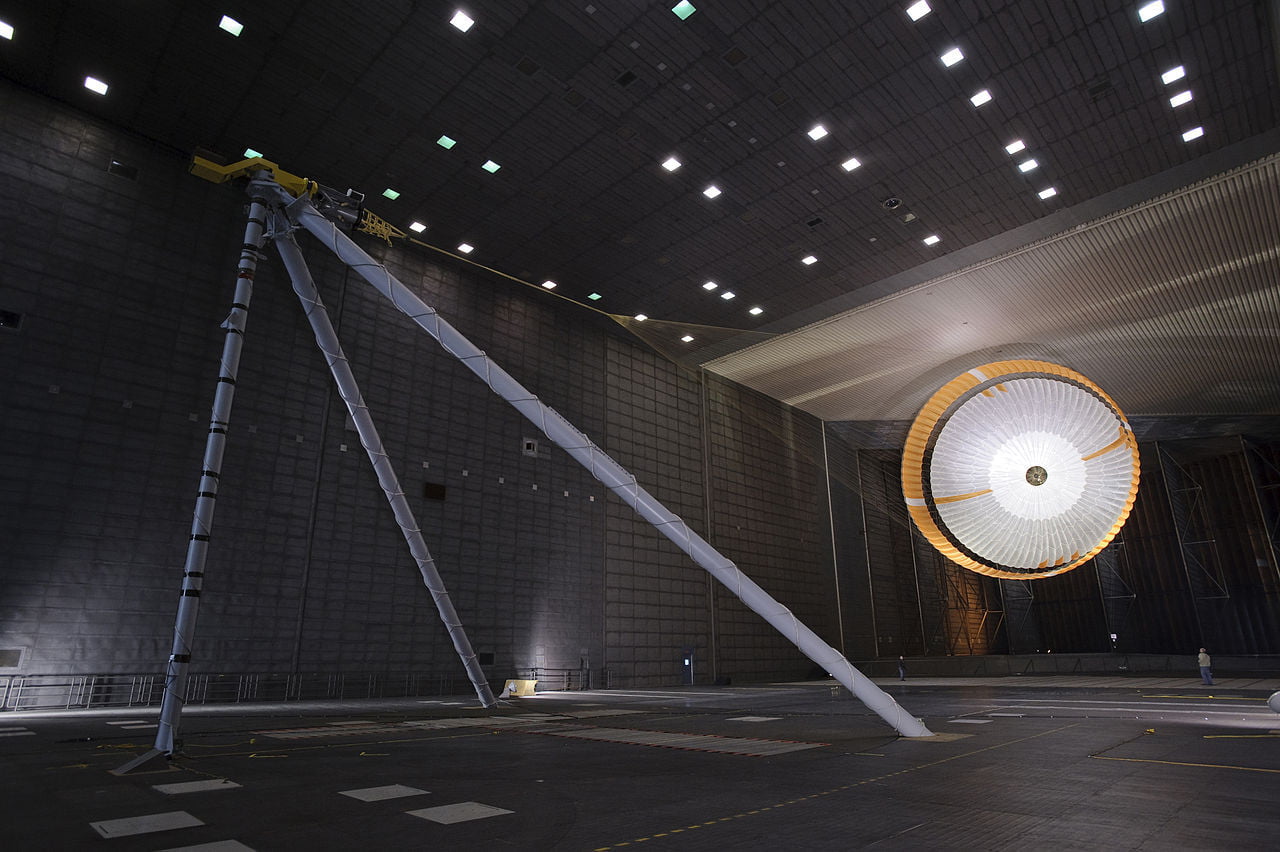
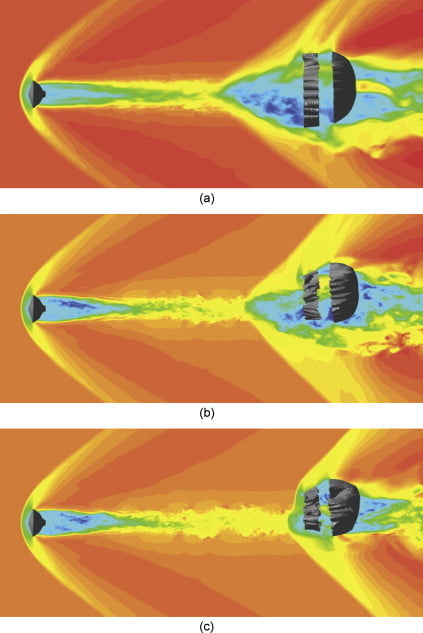
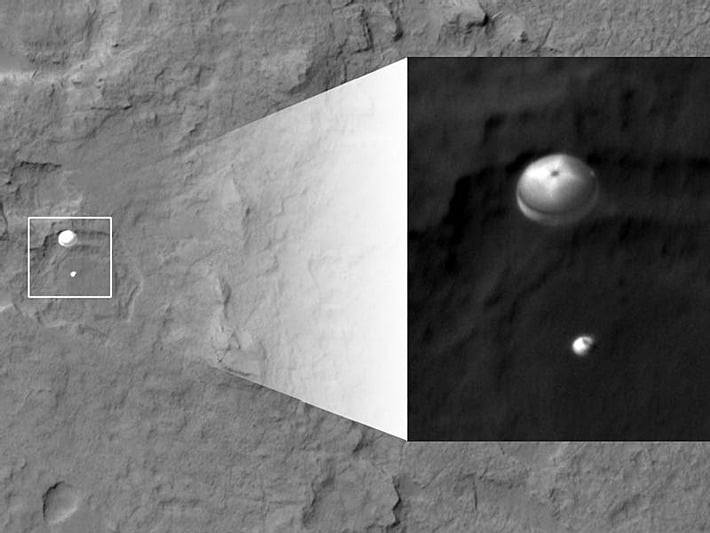
A little over a week ago, NASA’s Curiosity rover landed on Mars, the culmination of years of engineering. The mission’s landing, in particular, was the subject of intense scrutiny as Curiosity’s size necessitated some new techniques in the final segments of the landing sequence. As it hit the Martian atmosphere at 13,000 mph, the compression of the carbon dioxide behind the capsule’s shock wave slowed the descent. At roughly 1,000 mph–speeds still large enough to be supersonic–Curiosity deployed its parachute. Shown above are the parachute in numerical simulation (from Karagiozis et al. 2011), wind tunnel testing at NASA Ames, and during descent thanks to the Mars Reconnaissance Orbiter. The simulation shows contours of streamwise velocity at different configurations; note the bow shock off the capsule and the additional shocks off the parachute. These help generate the drag needed to slow the capsule. For an interesting behind-the-scenes look at the wind tunnel testing for Curiosity’s parachute check out JPL’s four–part video series. Congratulations to all the scientists and engineers who’ve made the rover a success. We look forward to your discoveries! (Photo credits: K. Karagiozis et al., NASA JPL, NASA MRO)

F-18 Flow Viz


Water tunnels are useful tools for determining aerodynamic characteristics of aircraft, such as this F-18 model placed in the NASA Dryden Flow Visualization Facility. By matching the Reynolds number of the model in the water tunnel to that of the full-scale aircraft in air, engineers can observe flow around the aircraft inside the laboratory. This similarity of flows is a powerful design tool. Here dye introduced along the nose, wings, and fuselage traces streamlines around the F-18, revealing areas of turbulence at different flight conditions.

Wind Tunneling Testing for BASE Jumpers
While we usually think of wind tunnel testing airplane models, the truth is that wind tunnels today test a much wider array of subjects. From oil rigs and skyscrapers to athletes and police sirens, if you can imagine it, it’s probably been stuck in a wind tunnel. This video shows some wind tunnel testing of a tracking suit used for BASE jumping. The primary focus seems to be on lift and drag at angle of attack–which can be used to determine glide ratios for the pilot–but there is also some study of localized turbulence generation, as evidenced by the use of smoke generators and the streamers attached to the suit’s arms and legs. (submitted by Jason C)
The Invisible Forces Behind a Lighter
This high-speed schlieren video reveals the ignition of a butane lighter. The schlieren optical technique exaggerates differences in refractive index caused by density variations, enabling experimentalists to see thermal eddies, shock waves, and other phenomena invisible to the naked eye. Here a jet of butane shoots upward from the lighter as a valve is released. Then the spark from the lighter ignites the butane gas near the bottom of the jet. A flame front the propagates outward and upward, completing the lighting process. (submitted by @Mark_K_Quinn)
Particle Image Velocimetry
One common experimental technique for measuring velocity in a flow is particle image velocimetry (PIV), shown above. Special particles are introduced–seeded–into the flow. Typically, these particles are small, neutrally buoyant, and have a refractive index significantly different from the background flow. One or more lasers are used to illuminate a section of the flow–a plane for 2D measurements or a cube for 3D. Rather than operating continuously, the laser is pulsed, producing very short exposure times of the order of hundreds of nanoseconds. A camera (or more than one camera for 3D measurements) captures a pair of images separated by this short exposure. The time between frames is so small that the particles will not have moved much between frames. Researchers can then correlate the two frames and derive velocity data from the motion of the particles.

Shuttlecock Flow Viz
The flow around a shuttlecock is visualized in a water channel using fluorescent dye illuminated by laser light ultraviolet LEDs. Note the recirculation zone on the upper shoulder. Experimenters can match flow characteristics in water to that in air by matching the Reynolds numbers. (Photo credit: Rob Bulmahn)
Updated, thanks to information from the photographer. Thanks!

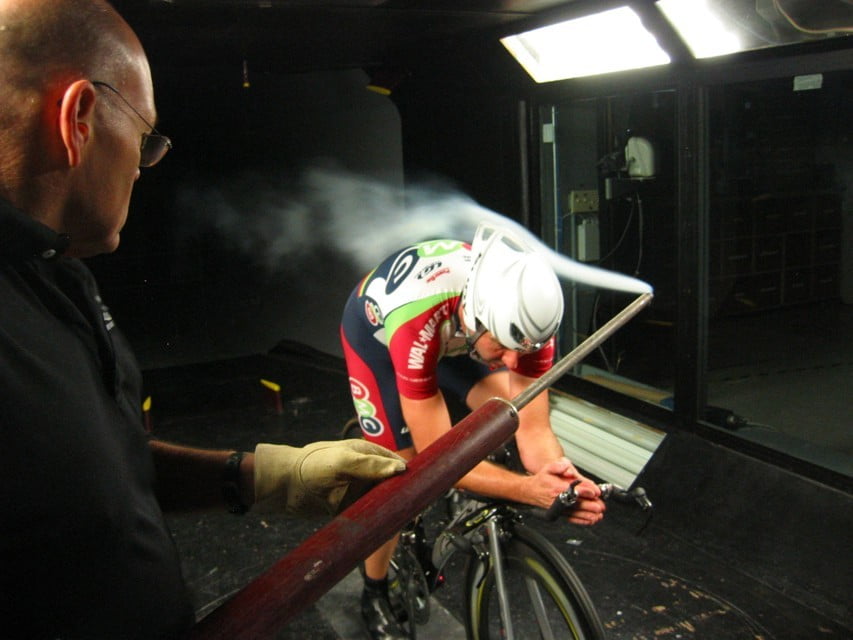
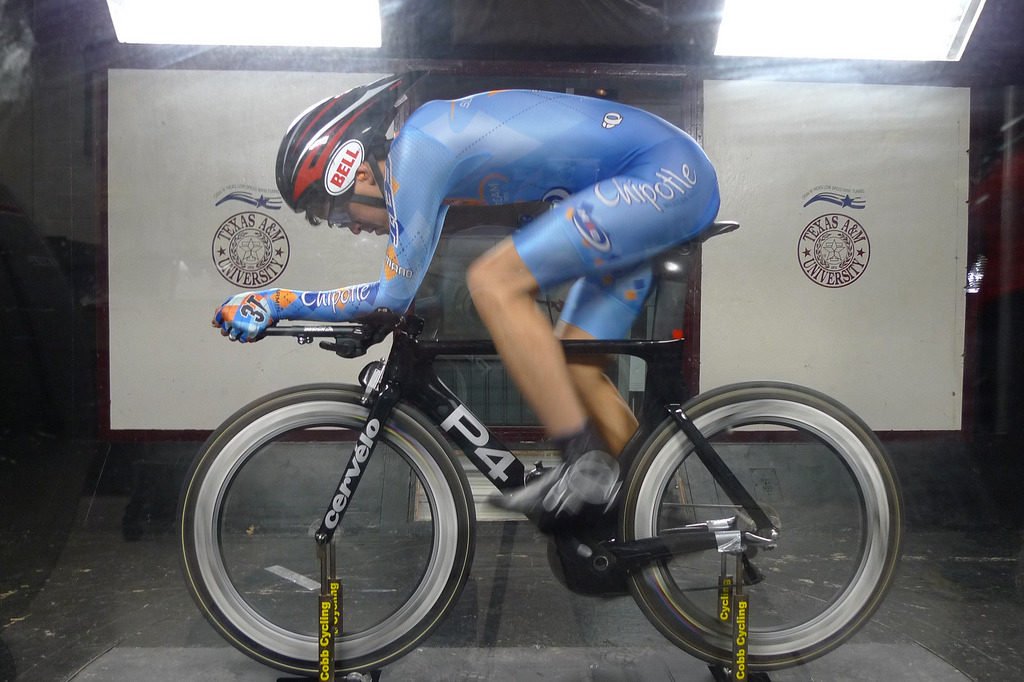
Tour de France Physics: Wind Tunnel Testing

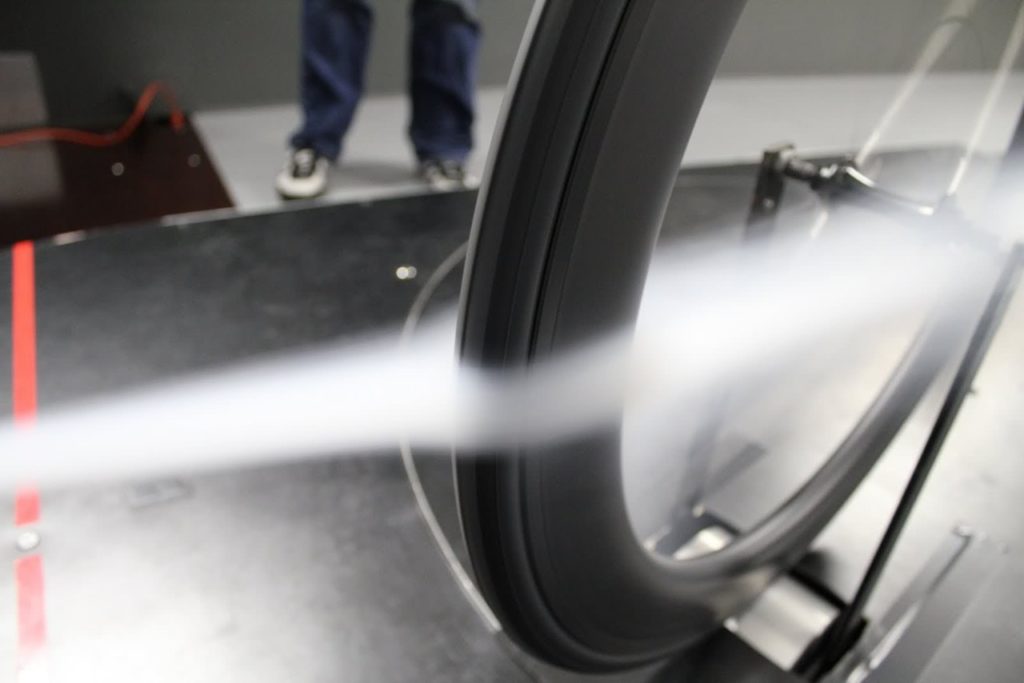
Over hours of racing, even a few grams of drag can be the difference between the top of the podium and missing out. For manufacturers as well as for individual professional cyclists, hours of wind tunnel testing help determine optimum configurations of equipment and positioning. During a day of wind tunnel testing, a cyclist may complete dozens of runs, in which bikes, wheels, helmets, skinsuits, and positioning are all tested and tweaked to find the best combination of aerodynamics.
But wind tunnel results don’t always translate perfectly to the road, where buildings, people, cars and other cyclists may interfere with the freestream. And, as any cyclist will attest, the wind is constantly shifting and changing speeds as one rides. The Garmin-Cervelo pro team has developed a rig to measure wind speeds and angles experienced by cyclists in real world conditions. (The exact components used are unclear, but probably include some form of Pitot tube or 5-hole probe.) As more on-the-road data is collected, wind tunnel tests can be improved by placing greater emphasis on the most common wind angle conditions. (Photo credits: John Cobb, Flo Cycling, and Nico T)
This completes FYFD’s weeklong celebration of the Tour de France and the fluid dynamics of cycling. See previous posts on drafting in the peloton, pacelining and echelons, the art of the sprint lead-out train, and the aerodynamics of time-trialing.

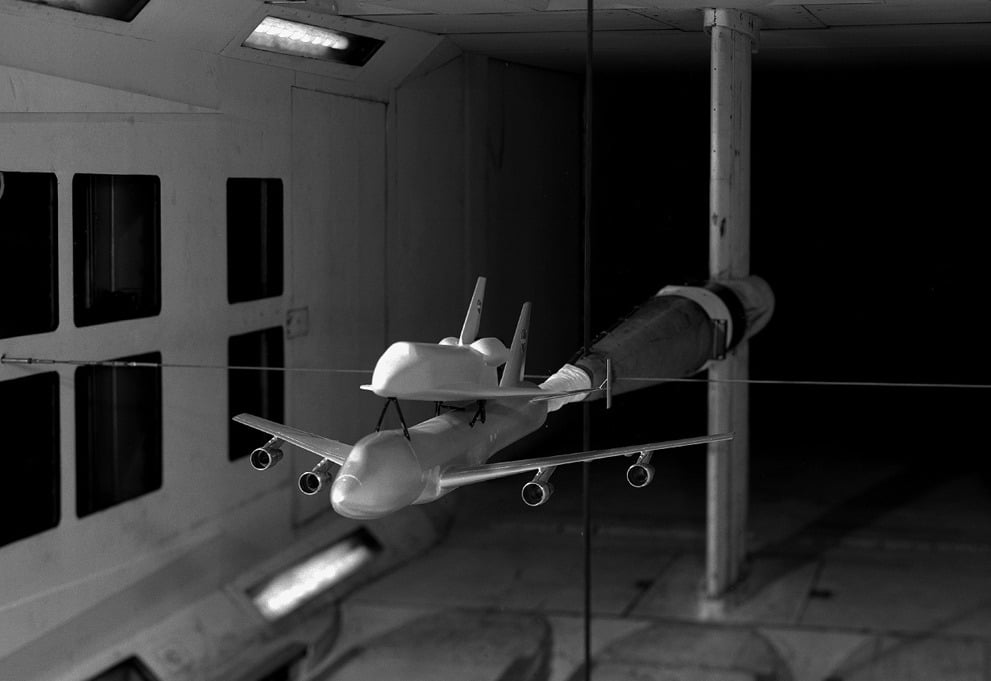
Wind Tunnel Testing
A scale model of the Space Shuttle attached to its modified 747 carrier hangs in a NASA wind tunnel. Wind tunnel tests can be used for flow visualization, lift and drag measurements, control system checks and so forth, but mounting models correctly and safely in the tunnel is crucial. Many models use sting mounts that project forward, as this one does, in order to expose the model to freestream flow unimpeded by the mounting mechanism. Any mounts and models must also be sturdy enough that all or part of them does not break off mid-test and fly into the wind tunnel’s fans. #

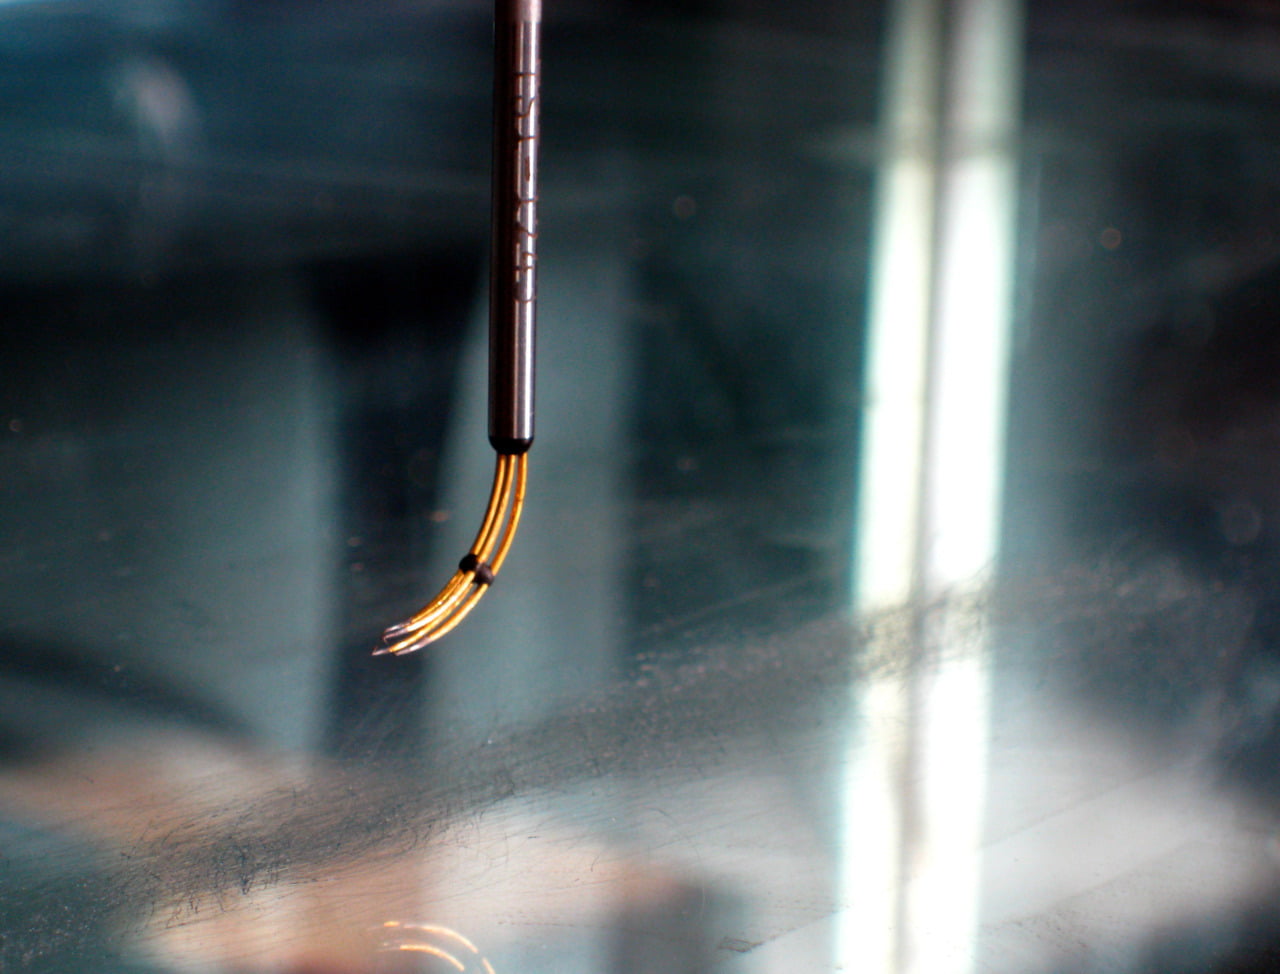
Hotwire Anemometry
Hotwire anemometry is used in experimental fluid dynamics to measure velocities with high temporal resolution. The boundary layer crosswire probe shown here was used for turbulence research. Between the prongs, which are about the thickness of a sewing needle, are tiny wires about 3 microns in diameter. A human hair is about 80 microns in diameter. Hotwires actually measure voltage; when part of an electrical circuit, the hotwire’s temperature rises above ambient. As air flows over the wire, it cools, which causes the wire’s resistance to drop. By tracking this change in resistance, it is possible to determine the speed of the air moving over the wire.