The motions of Earth’s atmosphere move more than just air and moisture. As seen in this animation built from NASA satellite data, the atmosphere also transports large amounts of small solid particles, or aerosols, such as dust. Each year the wind carries millions of tons of Saharan dust across the Atlantic, depositing much of it in the Amazon basin. This provides much needed nutrients like phosphorus to plants and animals in the Amazon; check out this video from the Brain Scoop to see what happens in areas that don’t receive these nutrients. Dust is only one of many sources for atmospheric aerosols, though. Sea salt, volcanic eruptions, and pollution are others. All of these aerosols serve as potential nucleation sites for raindrops or snowflakes, and their transport all around the globe by atmospheric winds means that seemingly local effects–like a regional drought or increased pollution in developing countries–can have global effects. (Video credit: NASA Goddard; submitted by entropy-perturbation)
Tag: wind
Sochi 2014: Ski Jump, Part 2
Yesterday we talked about the technique ski jumpers use to fly farther. Generating lift without too much drag is the key to a good jump. But jumpers are subject to ever-changing wind conditions, and those can help or hurt them. Unlike most sports, in ski jumping a headwind is desirable. This is because the added relative air velocity increases the jumper’s lift and helps them fly farther. A tailwind, on the other hand, saps their speed. Since 2009, ski jumping competitions have included a wind compensation factor that tries to account for these effects. Wind velocity is measured at five points along the jumper’s flight path and the tangential (i.e. head- or tailwind) components are weighted and averaged. The weighting factors seem to be individual to each hill – not all hills are built with the same profile. This average tangential wind speed is then a linear variable in an equation for wind factor. The goal of the wind factor is as much to make the competition run smoothly as it is to increase fairness. The trouble is that the wind speed effect is non-linear; in other words, a headwind does not help a jumper as much as a tailwind can hurt them. In one simulation study, researchers found a 3 m/s headwind carried jumpers 17.4 m further while a tailwind of the same magnitude shortened the jump by 29.1 m. The wind differences in competition may not be as drastic, but truly evening the playing field may require a more complicated compensation system. (Photo credit: B. Martin/Sports Illustrated)
FYFD is celebrating the Games with a look at fluid dynamics in the Winter Olympics. Check out our previous posts on the aerodynamics of speed skating, why ice is slippery and how lugers slide so fast.
Wind and Waves Visualized
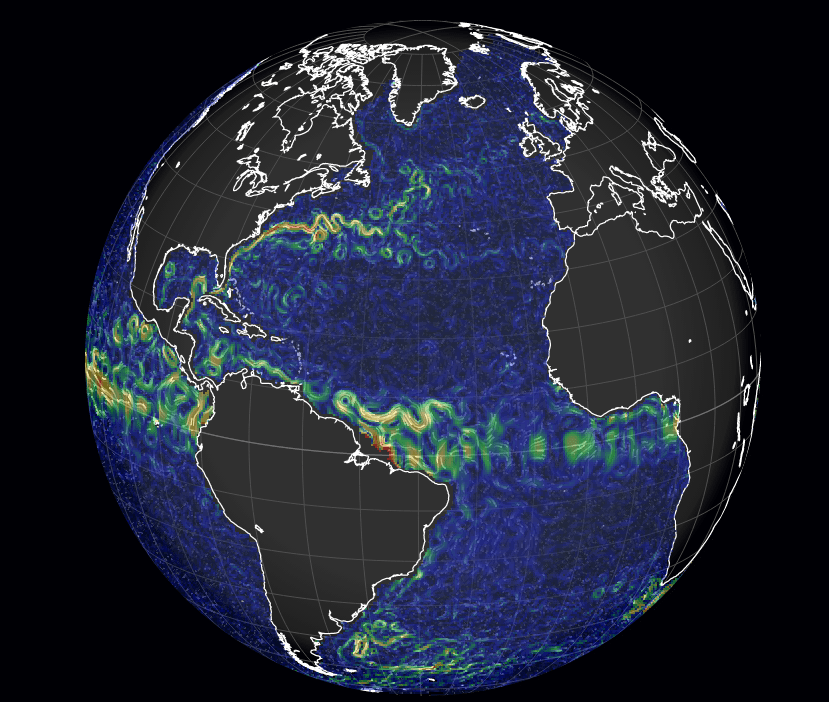
Much like the wind map we featured previously, designer Cameron Beccario’s visualizations of wind and ocean surface current data draw from near-real-time sources to create a stunning picture of fluid dynamics on a planetary scale. The number of options in terms of projections and data are really quite incredible, and you’ll want to play around to get a real sense for it. Want to see the wind and total precipitable water at 1000 hPa? Here you go. Maybe you prefer studying Pacific ocean currents. All the data are there to play with. People often wonder why weather forecasts aren’t always right, but, when you look at the scale and complexity of these flows, it’s almost a wonder that we can predict them at all. (Image credits:C. Beccario/earth; via skunkbear and io9)
Fluids Round-up – 23 June 2013
Time for another round-up! Here are the recent fluidsy links I’ve collected:
- A new study on Mars suggests that dry ice may be forming gullies in dunes in a fashion akin to the Leidenfrost effect. Personally, I’m reminded of Death Valley’s roaming rocks.
- A recent episode of It’s Okay to Be Smart explains what wind is.
- xkcd’s What If blog explores what would happen if you row a boat on different fluids such as mercury, bromine, and liquid helium (for you superfluid aficionados).
- Those who love microfluidics may want to follow Physics in Drops for some small-scale fluid fun.
- Not explicitly fluid dynamical, but this video of a peregrine falcon chasing a downhill mountain biker has some great examples of aerodynamics and the in-flight agility of birds.
- For the Android users among you, be sure to check out Fleya, a multi-touch, real-time fluids simulator. (via Jeremy M/Flow Visualization)
(Photo credit: Fixed Point Code)
Cracks in Sea Ice
Arctic sea ice often appears as a single extensive sheet when, in reality, it is made up of many smaller sections of ice shifting and grinding against one another under the influence of winds and ocean currents. This can cause cracks–known as leads–to open up between sections of the ice. This animation, constructed from infrared satellite images, shows the growth of several cracks, leading to extensive break-up of the ice sheet from late-January through March. The fracturing was driven by a high-pressure system that parked over the region, bringing warmer temperatures and southwesterly winds that fueled the Beaufort Gyre, a large-scale, wind-driven, clockwise circulation in the sea that helped pull the ice apart. For more, see NASA EO’s explanation. (Video credit: NASA Earth Observatory)
Fluidic Public Art by Charles Sowers
Artist Charles Sowers creates exhibits and public art focused on illuminating natural phenomenon that might otherwise go unnoticed, and much of his work features fluid dynamics directly or indirectly. “Windswept” and “Wave Wall” are both outdoor exhibits that show undulations and vortices corresponding to local wind flow. Other pieces explore ferrofluids through magnetic mazes or feature foggy turbulence. My own favorite, “Drip Chamber”, oozes with viscous fluids whose dripping forms patterns reminiscent of convection cells. Be sure to check out his website for videos of the exhibits in action. (Photo credits: Charles Sowers; submitted by rreis)
London 2012: Running Aerodynamics
Running is not an event typically associated with aerodynamics, though any runner will tell you that a headwind can slow them down. For comparison, a swimmer on world record pace sees 40 to 50 times the drag force of a runner over the same distance. But despite the relatively small influence of drag on a runner, there are measurable effects due to wind and altitude when races are judged by hundredths of a second. Given this, it comes as no surprise that researchers (and presumably manufacturers) are starting to considering how to optimize aerodynamics in running. The video above describes results of a study on running shoes that suggests modest savings may be derived from shoes with dimpled surfaces, much like a golf ball. Socks, on the other hand, don’t show any aerodynamic savings from special surfaces. Of course, the bulk of a runner’s drag comes from their hair and clothing; this is, in part, why runners wear form fitting clothes. While there may be some aerodynamic savings to be had, I don’t think we’ll see world records falling like crazy in Rio because of the latest new shoes.
FYFD is celebrating the Olympics by featuring the fluid dynamics of sport. Check out our previous posts on how the Olympic torch works, what makes a pool fast, the aerodynamics of archery, the science of badminton, how cyclists get “aero”, and how divers reduce splash.
How the Sun Drives the Earth
This video describes how the sun’s energy drives wind and ocean currents on earth. As solar winds stream forth from the sun, our magnetosphere deflects the brunt of the impact (creating auroras at the poles) while the atmosphere, land masses, and oceans absorb thermal energy from the sun’s light. Because of our cycles of day and night and the differences in how land, water, and ice absorb heat, temperature differentials around the earth drive a massive heat engine, causing the circulation of water and wind all around our world. Numerical simulations like the ones underlying this video are vital for the prediction of climate and weather, as well as for developing models and techniques that can be applied to other problems in science and engineering. (Video credit: NASA; via Gizmodo)
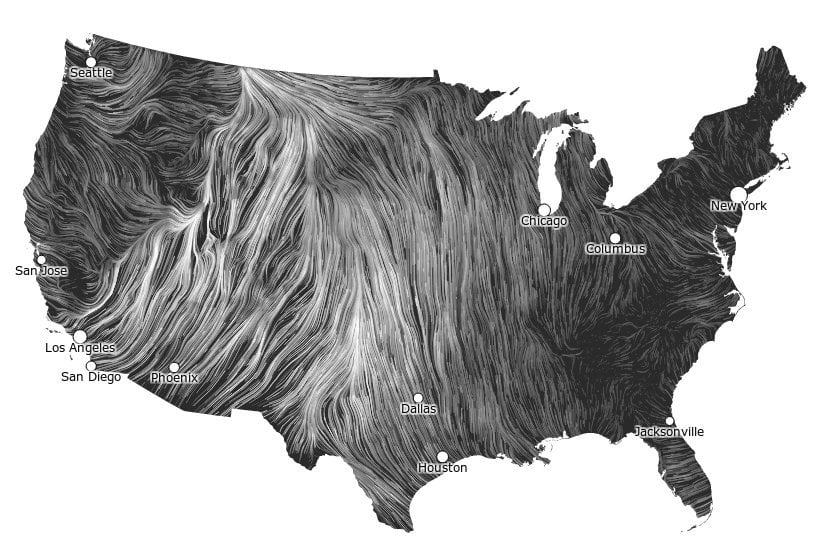
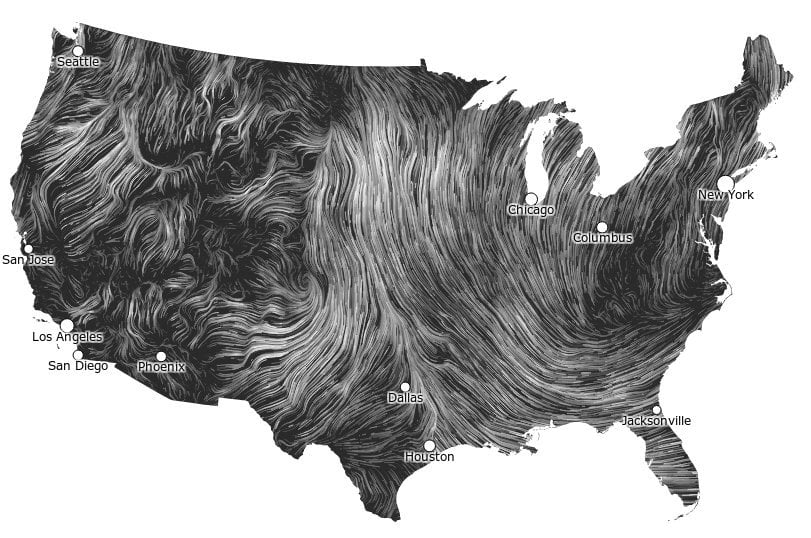
Winds Across the US
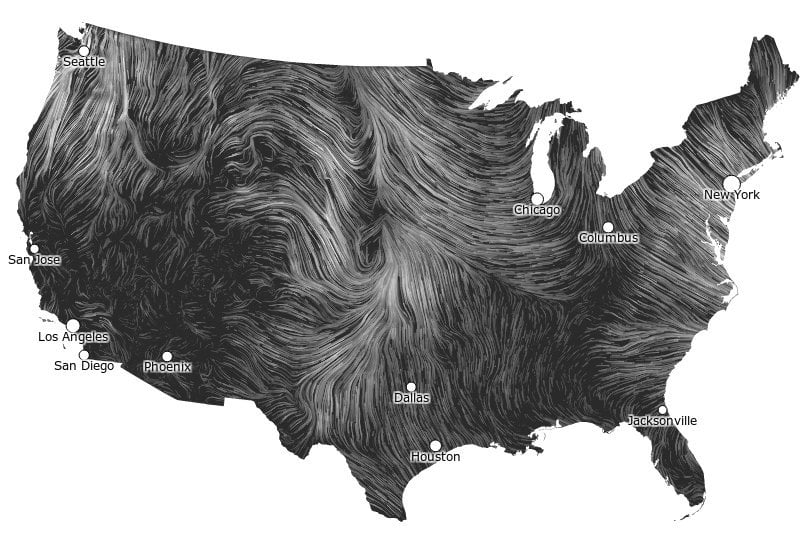
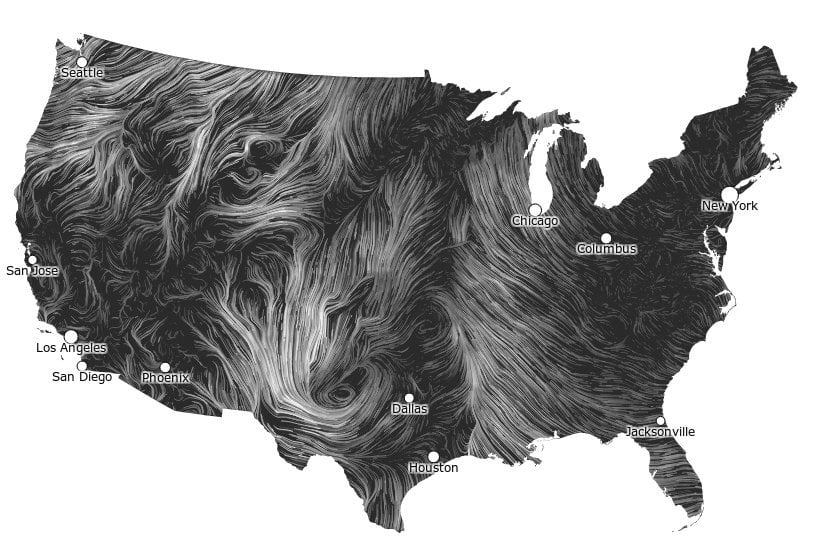
A collaborative project on data visualization brings to life the wind velocity data across the United States. The Wind Map is an interactive, nearly real-time indicator of wind conditions across the country, compiled on an hourly basis from the National Digital Forecast Database. Be sure to click through to see the data in motion. Observing the variety in wind patterns over the scale of days brings to light the swirling motion of surface winds much the way Perpetual Ocean does for surface currents. Fluid dynamics are all around us. (via Gizmodo)