
Ocean currents play a major role in the weather and climate of our planet. This video shows a simulation of the surface ocean currents in the Mediterranean and Atlantic over an 11-month period. Each second corresponds to 2.75 days. You’ll see many swirling eddies in the Mediterranean and more flow along the coastlines in the Atlantic. One observation worth noting: near the end of the video, you’ll notice that flow through the Strait of Dover between England and France changes its direction, flowing back and forth depending on tidal forces. In contrast, flow through the Strait of Gibraltar is always into the Mediterranean (within the timescale of the simulation, at least). This net in-flow to the Mediterranean is due in part to the warm waters there evaporating at a higher rate than the cooler Atlantic. (Video credit: NASA; via Flow Viz; h/t to Ralph L)
Tag: ocean currents

Coastal Upwelling
Cool temperatures and abundant nutrients make the waters off the western coast of North America especially biologically productive. This image is a composite of satellite data highlighting large phytoplankton blooms in the California Current. This current runs southward along the coastline, and, like other eastern boundary currents, it experiences strong upwelling, or rising of colder, nutrient-rich waters from lower depths. The upwelling is driven in part by Earth’s rotation. As the earth spins, Coriolis effects push the California Current out from the coast, allowing deeper waters to rise and fill the void. The cooler water provided by the upwelling is a major factor in the moderated climate along the West Coast. (Image credit: NASA/N.Kuring; via NASA Earth Observatory)

Underwater Currents
Like the atmosphere, the ocean is constantly in motion, churned by currents that often go unnoticed by humans watching the surface. Filmmaker Julie Gautier and free diver Guillaume Néry demonstrate the power and speed of some of these underwater currents in the film above. The footage was shot in Tiputa Pass, part of an atoll northeast of Tahiti. In it, Néry serves as a human-shaped seed particle in the flow, illustrating just how swift the current is. (Video credit: J. Gautier; via Colossal; submitted by jshoer)

Interrupting Sediments
The pier at Progreso extends 6.5 kilometers into the Gulf of Mexico, creating an artificial obstruction to ocean flow and sediment transport near the shore. The first 2 kilometers of the pier are built on arches that allow some flow through, but the newer sections do not. Prevailing winds act from the east-northeast, driving flow roughly right to left in the image. The sediment traces flow around the pier and reveals the complicated flow-shadow downstream of the newer parts of the pier. (Image credit: NASA Earth Observatory)

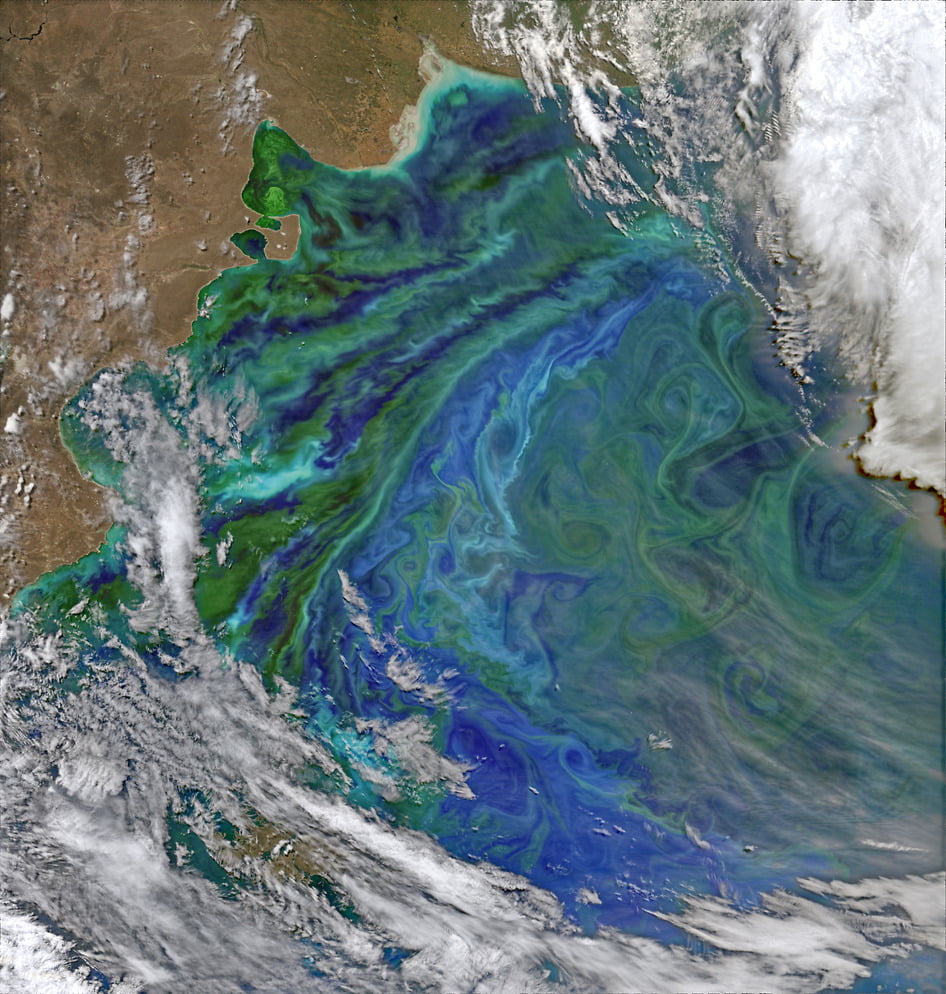
Phytoplankton Flow Viz
Nutrient-rich waters off Patagonia in South America blossom with phytoplankton in this satellite image. When present in large quantities, these microscopic photosynthesizers lend a green hue to the water. They act as seed particles in the flow, highlighting the currents and flow that carry them. If you check out the full resolution version of the photo, you can admire the rich detail in the whorls of ocean mixing. There even seem to be Kelvin-Helmholtz-like instabilities creating trains of vortices along the interface between separate bands. (Photo credit: NASA/ASU; via SpaceRef; submitted by jshoer)
Double-Diffusive Convection
Convection can be driven several mechanisms, including temperature and concentration differences. The video above shows convection between a a layer of sucrose solution and a layer of saline solution. Initially, the lighter sucrose layer sits over the denser salt water. After the interface is perturbed, the differences in concentration – and thus in density – between the fluids causes diffusion both upward and downward in the form of fingers. This instability behavior is analogous to salt-fingering, which occurs in the ocean when a layer of warm, salty water lies over a layer of cooler, less saline water. In the ocean, these temperature and salinity differences help drive ocean circulation as well as the mixing that occurs between different depths. (Video credit: William Jewell College)

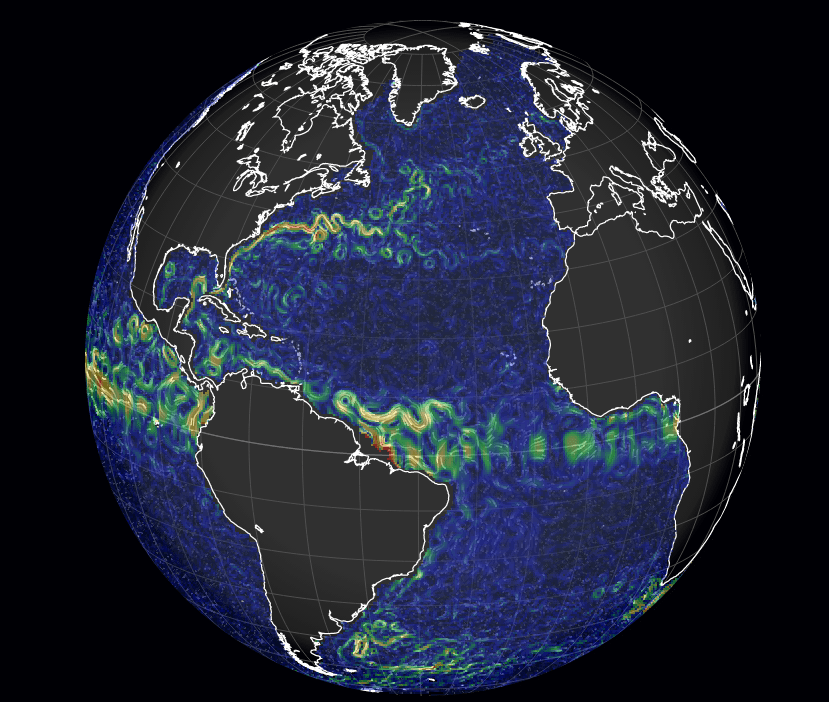
Wind and Waves Visualized

Much like the wind map we featured previously, designer Cameron Beccario’s visualizations of wind and ocean surface current data draw from near-real-time sources to create a stunning picture of fluid dynamics on a planetary scale. The number of options in terms of projections and data are really quite incredible, and you’ll want to play around to get a real sense for it. Want to see the wind and total precipitable water at 1000 hPa? Here you go. Maybe you prefer studying Pacific ocean currents. All the data are there to play with. People often wonder why weather forecasts aren’t always right, but, when you look at the scale and complexity of these flows, it’s almost a wonder that we can predict them at all. (Image credits:C. Beccario/earth; via skunkbear and io9)

Reader Question: Oceans Meeting?
Reader favoringfire asks:
Hi! Maybe you can help me: I’ve seen a pic revolving around Tumblr from the Danish city of Skagen showing the Baltic and North sea meeting. Where they meet the ocean is two very distinct hues of blue–what captions say are “two opposing tides with different densities.” Tides? Currents w/different temps often are often diff color from one another. But can “tides” be of different “densities???”
After some searching, I think the photo above is probably the one you’ve seen represented as where the Baltic and North Seas meet. It turns out, however, that it’s not. It’s a photo from an Alaskan cruise taken by Kent Smith. Fluid dynamically, though, it’s still very interesting! What we see here is a sharp gradient between regions with very different densities. One side contains lots of freshwater from rivers fed by melting glaciers, which creates a very different density from the general seawater.
It’s not true, however, that the two won’t mix. This border is not a static phenomenon but one that is ever-changing due to currents and the diffusion of one fluid into another. In a sense, this photo is very much the sea-level version of photos like these which show the massive scale of sediment transport and nutrient mixing that occur in our oceans.
(Photo credit: K. Smith)

Real-Life Whirlpools

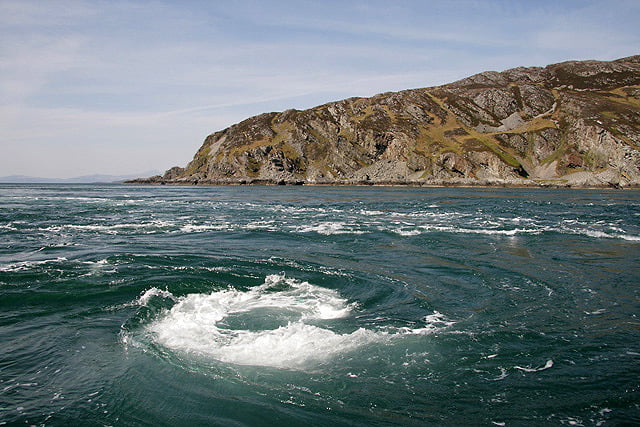
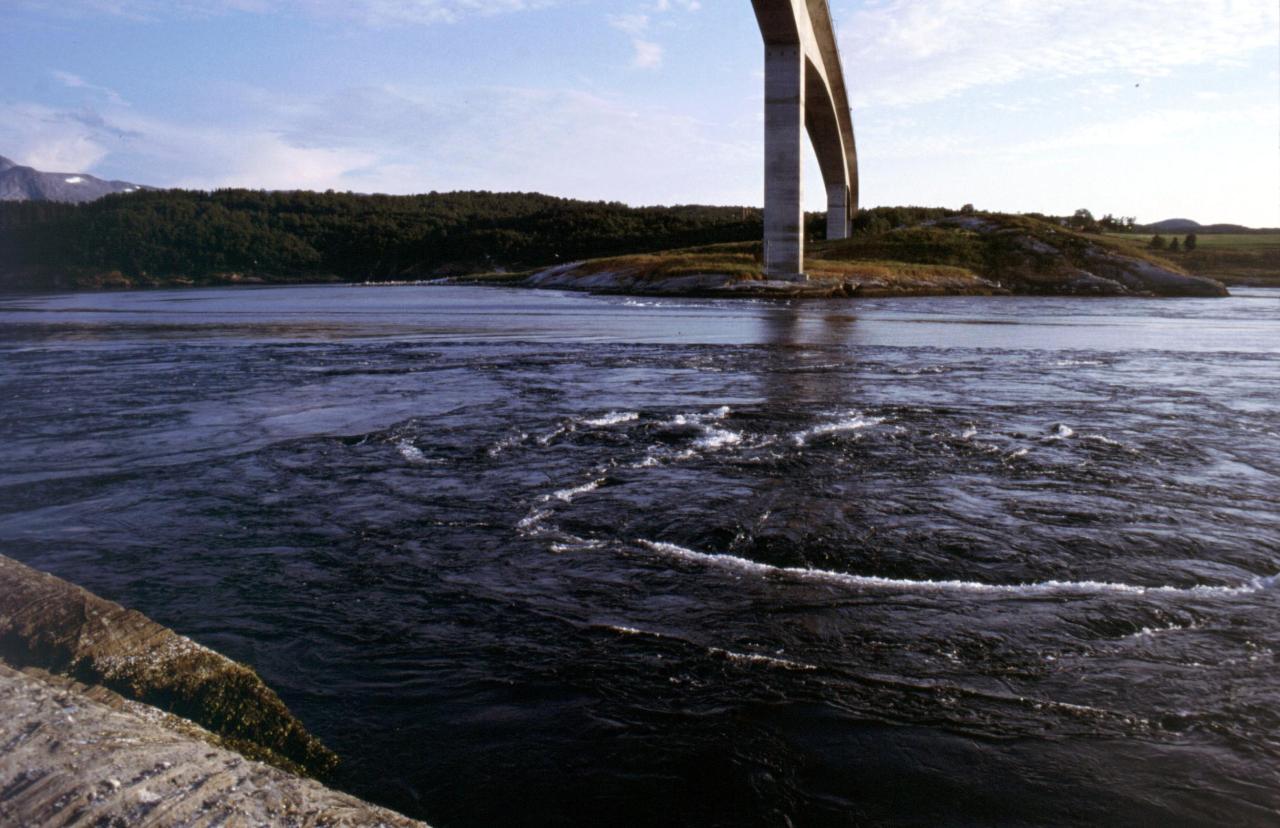
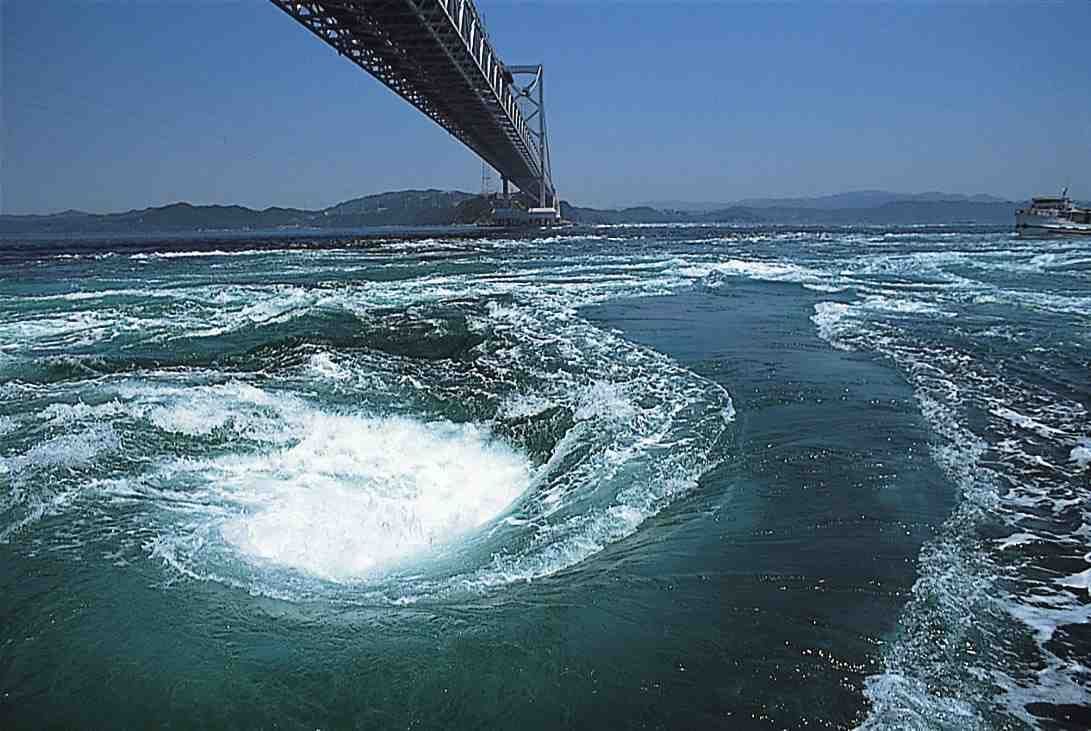
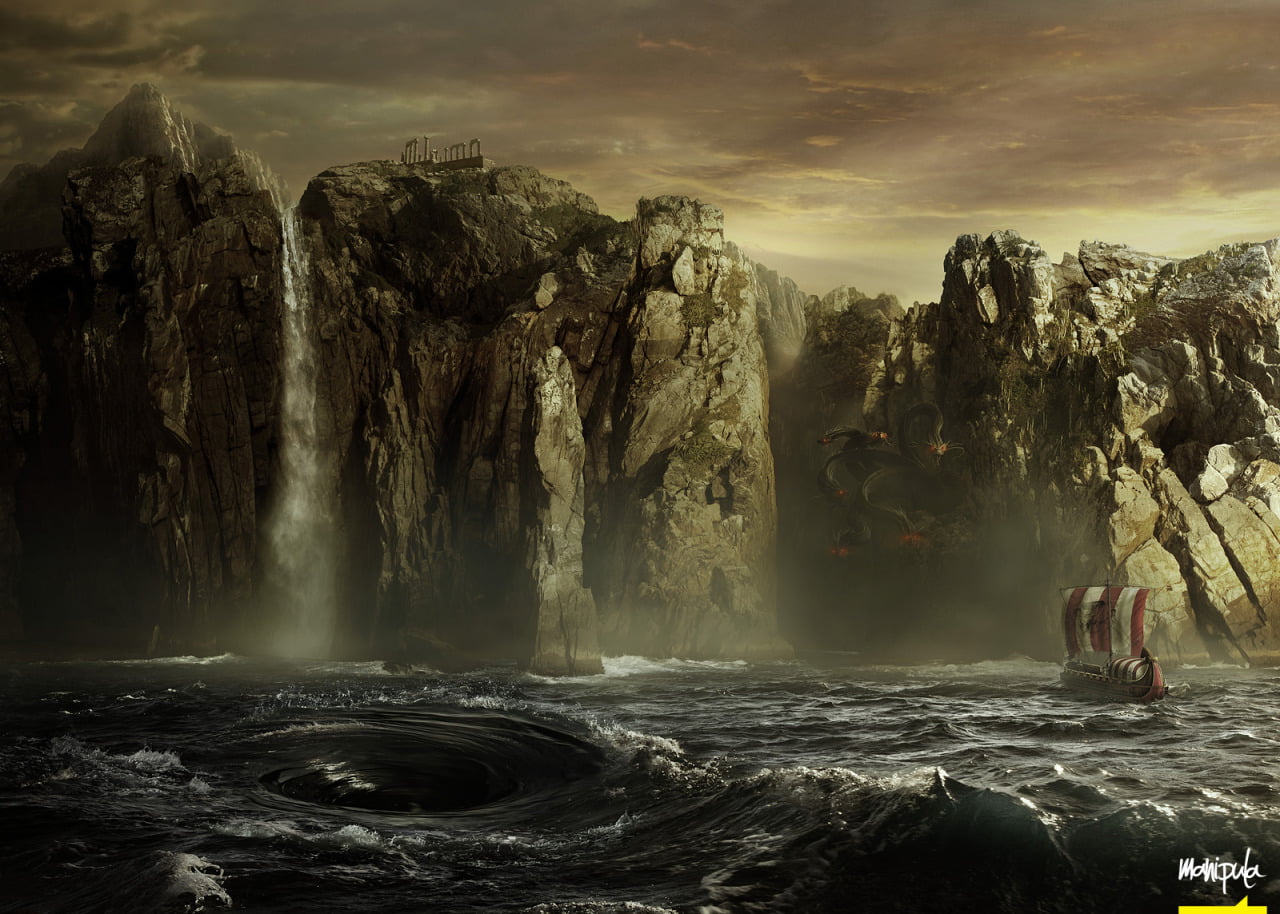
Literature is full of descriptions of monstrous whirlpools like Charybdis, which threatens Homer’s Odysseus. While it’s not unusual to see a small free vortex in bodies of water, most people would chalk boat-swallowing maelstroms up to literary device. But it turns out that, while there may not be permanent Hollywood-style whirlpools, there are several places in the world where the local tides, currents, and topology combine to produce turbulence, dangerously vortical waters, and even standing vortices on a regular basis.
One example is the Corryvreckan, between the islands of Jura and Scarba off Scotland. In this narrow strait, Atlantic currents are funneled down a deep hole and then thrust upward by a pinnacle of rock that rises some 170 m to only 30 m below the surface. The swift waters and unusual topology produce strong turbulence near the surface and whirlpools pop up throughout the strait. Other “permanent” maelstroms, such as those in Norway and Japan, arise from tidal interactions with similar structures rising from the sea floor.
For more, check out this Smithsonian article, Gjevik et al., Moe et al., and the videos linked above! (Photo credits: Manipula, Tokushima Gov’t, Wikimedia, and W. Baxter; requested by @kb8s)
Cracks in Sea Ice
Arctic sea ice often appears as a single extensive sheet when, in reality, it is made up of many smaller sections of ice shifting and grinding against one another under the influence of winds and ocean currents. This can cause cracks–known as leads–to open up between sections of the ice. This animation, constructed from infrared satellite images, shows the growth of several cracks, leading to extensive break-up of the ice sheet from late-January through March. The fracturing was driven by a high-pressure system that parked over the region, bringing warmer temperatures and southwesterly winds that fueled the Beaufort Gyre, a large-scale, wind-driven, clockwise circulation in the sea that helped pull the ice apart. For more, see NASA EO’s explanation. (Video credit: NASA Earth Observatory)


