Trees are incredible organisms, with some species capable of growing more than 100 meters in height. But how do trees get so big and why don’t they grow even taller? The limit, it turns out, is how far fluid forces can win over gravity.
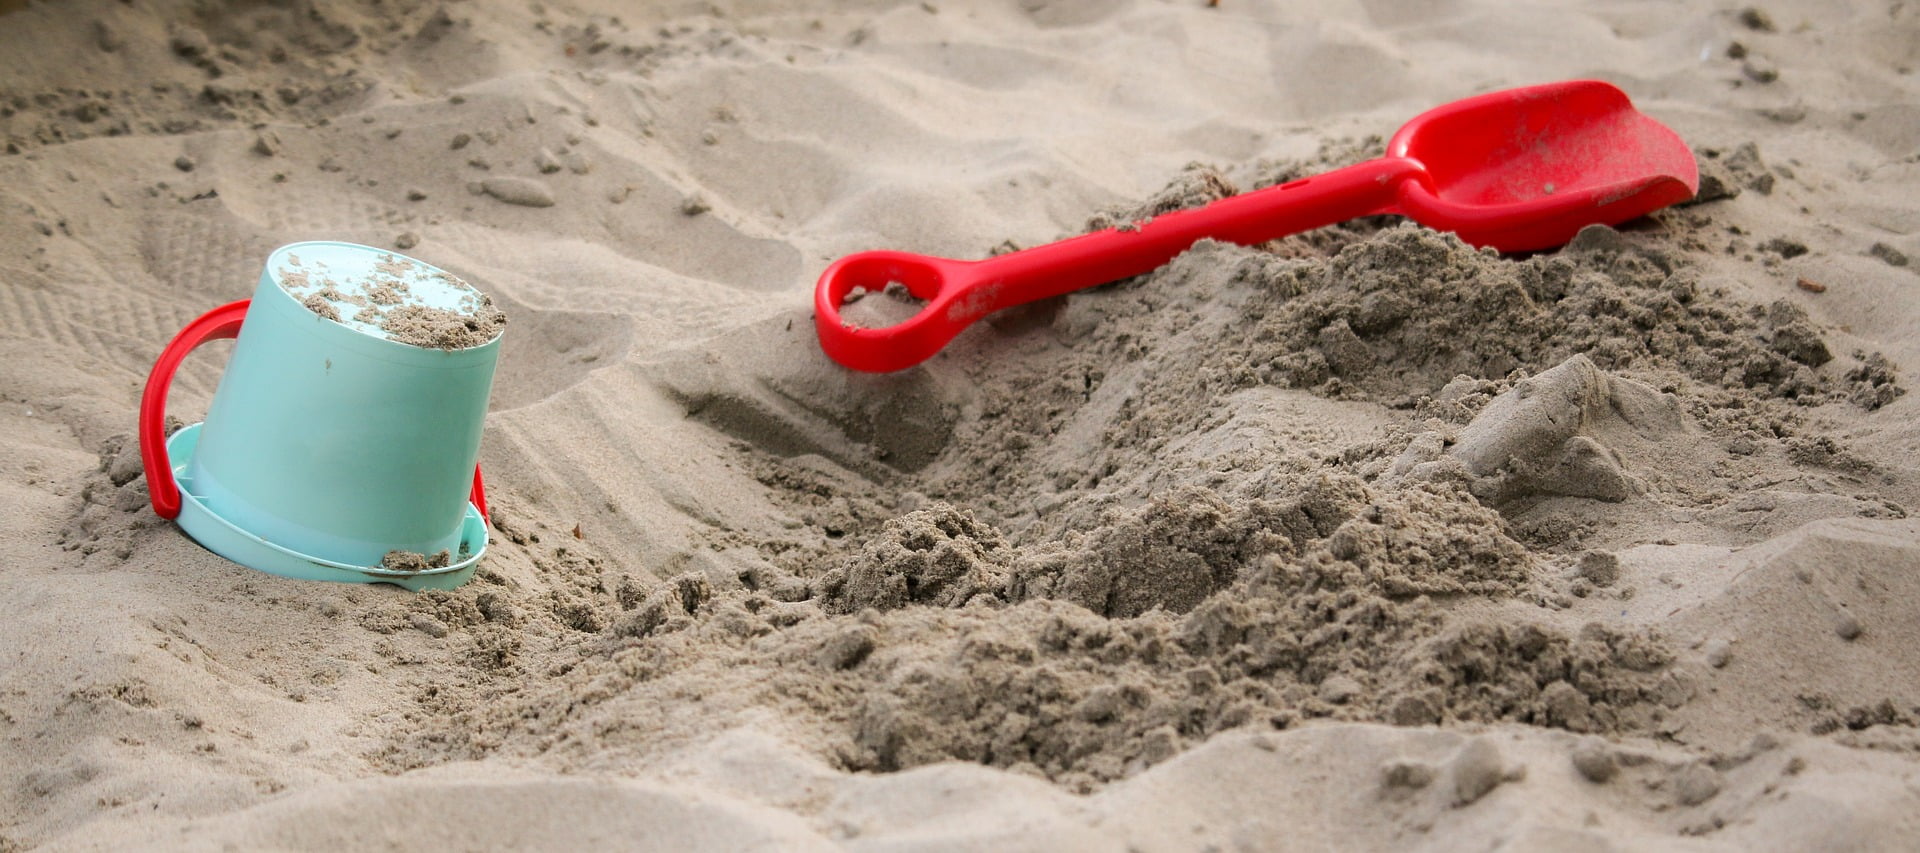
To live and grow, trees must be able to transport nutrients between their roots and their highest branches. As explained in the video, there are three forces that enable this transport inside trees: transpiration, capillary action, and root pressure. Of these, you are probably most familiar with capillary action, where intermolecular forces help liquids climb up the inside of narrow spaces, like the straw in your drink. Capillary action can’t lift liquids more than a few centimeters against gravity, though.
Similarly, root pressure is limited in how far it can raise liquids. Functionally, it’s pretty similar to the way a column of water or mercury can be held up by atmospheric pressure acting at the base of a barometer. But atmospheric pressure can only hold up 10.3 meters of water, so what’s a tree to do?
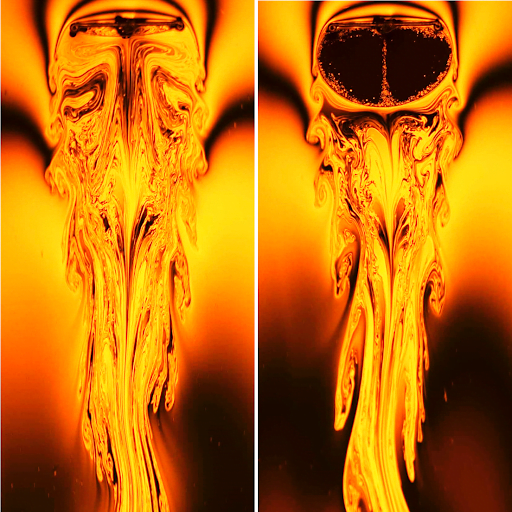
This is where transpiration — the most important force for sap transport in the tree — comes in. As water evaporates out of the tree’s leaves, it creates negative pressure that — along with water’s natural cohesion — literally drags sap up from the roots. It’s this massive pull that drives the flow and enables most of a tree’s height. (Image and video credit: TED-Ed)