Fish detect turbulence in the water around them; among other things, this helps them avoid colliding with objects. Here, researchers are looking to understand how fish interact with underwater turbines. Experiments give them a set of trajectories that actual fish follow when dealing with the experimental turbine. But to understand what the fish is detecting, the researchers build a digital facsimile of the turbine and use Large Eddy Simulation (LES) to calculate the turbine’s wake.
By overlaying the fish trajectories onto the simulated flow structures, they can better understand what flows the fish is and is not comfortable with. That knowledge helps engineers design turbines with smaller ecological impact. (Video and image credit: H. Seyedzadeh et al.)
Calculating turbulent flows like those found in the ocean and atmosphere is extremely expensive computationally. That’s why forecasting models use techniques like Large Eddy Simulation (LES), where large physical scales are calculated according to the governing physical equations while smaller scales are approximated with mathematical models. Researchers are always looking for ways to improve these models–making them more physically accurate, easier to compute, and more computationally stable.
In a new study, researchers used an equation-discovery tool to find new improvements to these models for the smaller turbulent scales. They started by doing a full, computationally expensive calculation of the turbulent flow. The equation-discovery tool then analyzed these results, looking to match them to a library of over 900 possible equations. When it found a form that fit the data, the researchers were then able to show analytically how to derive that equation from the underlying physics. The result is a new equation that models these smaller scales in a way that’s physically accurate and computationally stable, offering possibilities for better LES. (Image credit: CasSa Paintings; research credit: K. Jakhar et al.; via APS)
Adding just a little polymer to a pipe flow speeds it up by reducing drag near the wall. But the effects on turbulence away from the wall have been harder to suss out. A new experiment shows that added polymers suppress eddy formation in the flow and reduce how much energy is lost to friction and, ultimately, heat. In particular, the researchers found that polymer stress helped stabilize shear layers in the flow and prevent them from destabilizing into more turbulent flow. (Image credit: S. Wilkinson; research credit: Y. Zhang et al.; via APS)
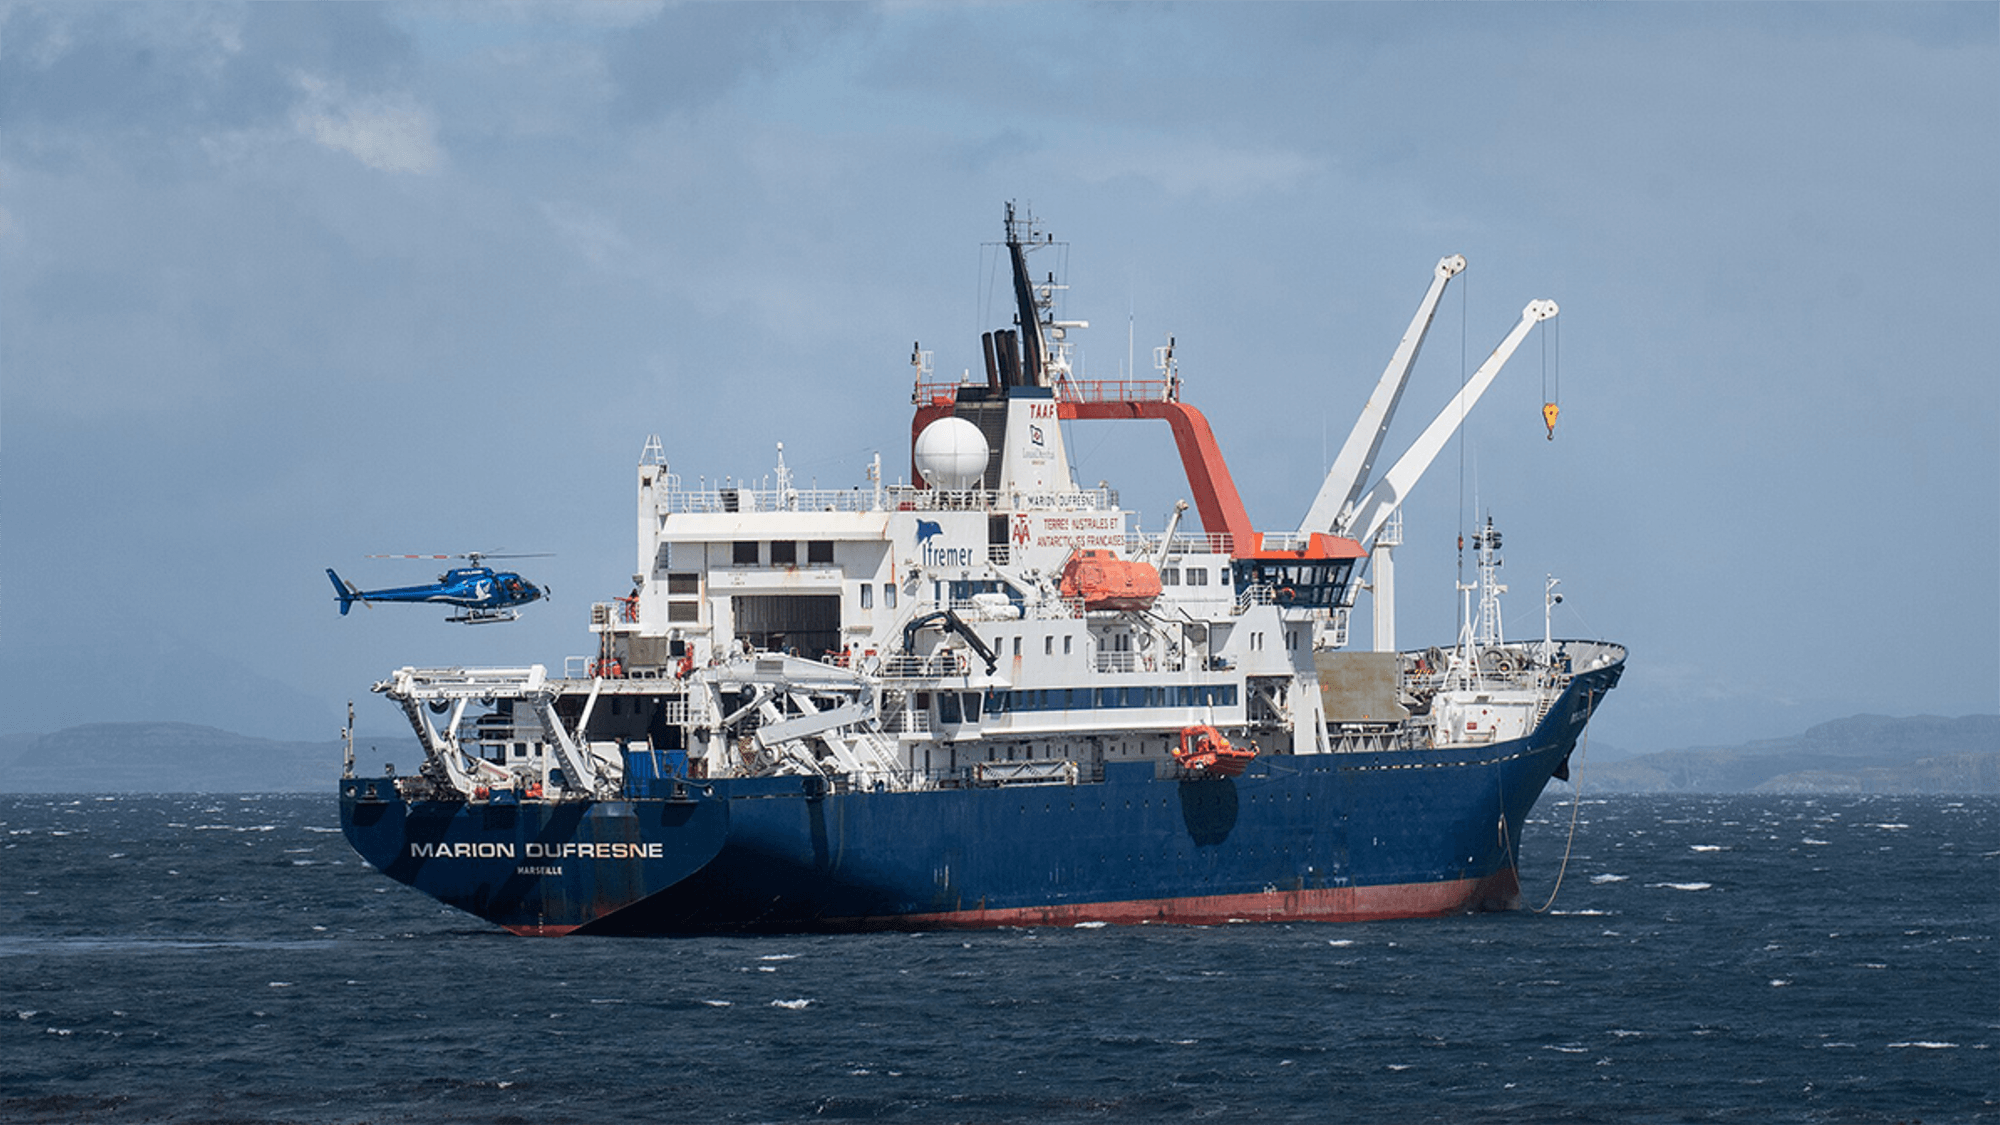
The Mozambique Channel boasts some of the world’s most turbulent waters, driven by eddies hundreds of kilometers wide. Eddies of this size — known as mesoscale — determine regional flows that influence local biodiversity, sediment mixing, and how plastic pollution moves. To better understand the region, scientists measured a mesoscale dipole from a research vessel.
Illustration of flows in the Mozambique Channel. The anticyclonic ring in dark blue rotates counterclockwise and consists of largely uniform water (labeled Ring: R1). To the south, in green, a cyclonic eddy rotates in a clockwise sense (labeled Cyclone: C1). This area is chlorophyll-rich and has varying salinity levels. Between the two is a filament of chlorophyll-rich water being drawn from the near-shore region (labeled Filament: F1).
The dipole consisted of a large anticyclonic ring (shown in dark blue) that rotated counterclockwise and a smaller cyclonic eddy (shown in green) that rotated clockwise. Between these eddies lay a central jet moving up to 130 centimeters per second that drew material out from the shoreline. In the anticyclonic ring, researchers found largely uniform waters with little chlorophyll. The cyclonic eddy, in contrast, was high in chlorophyll and had large variations in salinity. Those smaller-scale variations, they found, helped to drive vertical motions of up to 40 meters per day.
In situ measurements like these help scientists understand how energy flows through different scales in the ocean and how that energy helps transport nutrients, sediment, and pollution regionally. Such measurements also help us to refine ocean models that enable us to predict this transport and how regions will change as climate patterns shift. (Image credit: ship – A. Lamielle/Wikimedia Commons, eddies – P. Penven et al.; research credit: P. Penven et al.; via Eos)
In February 2024, the North Atlantic’s sea ice reached its furthest extent of the season, limning the coastline with tens of kilometers of ice. These images — both capturing the Labrador coast on the same day — show the swirling patterns marking the wispy edges of ice field. In this region, the ice is likely following an eddy in the ocean below. Eddies like these can form along the edges where warm and cold currents meet. An ice eddy is particularly special, though, as the water must be warm enough to fragment the sea ice, but not so warm that it melts the smaller ice pieces. (Image credit: top – NASA, lower – M. Garrison; via NASA Earth Observatory)
This satellite image shows sea ice off the Labrador coast, on the same day in February 2024.
James Bond notoriously orders his martinis “shaken, not stirred,” a request bartenders fulfill by shaking the cocktail over ice in a separate shaker. But what if you shake the martini glass itself? That’s the question that inspired this lovely mixology.
By shaking the martini glass gently back and forth (along the directions shown by the arrows in each image), the team created different mixing patterns within the glass. With a little food dye and pearl dust, they visualized the flows they found. By changing the viscosity of the cocktail and the speed of the swish, they made everything from a four-leaf clover to a cadre of ghosts. It seems that martini glasses hold a flow for every occasion! (Image and research credit: X. Song et al.; submitted by Zhao P.)
GFM poster, describing the experiments used to create these picturesque martinis.
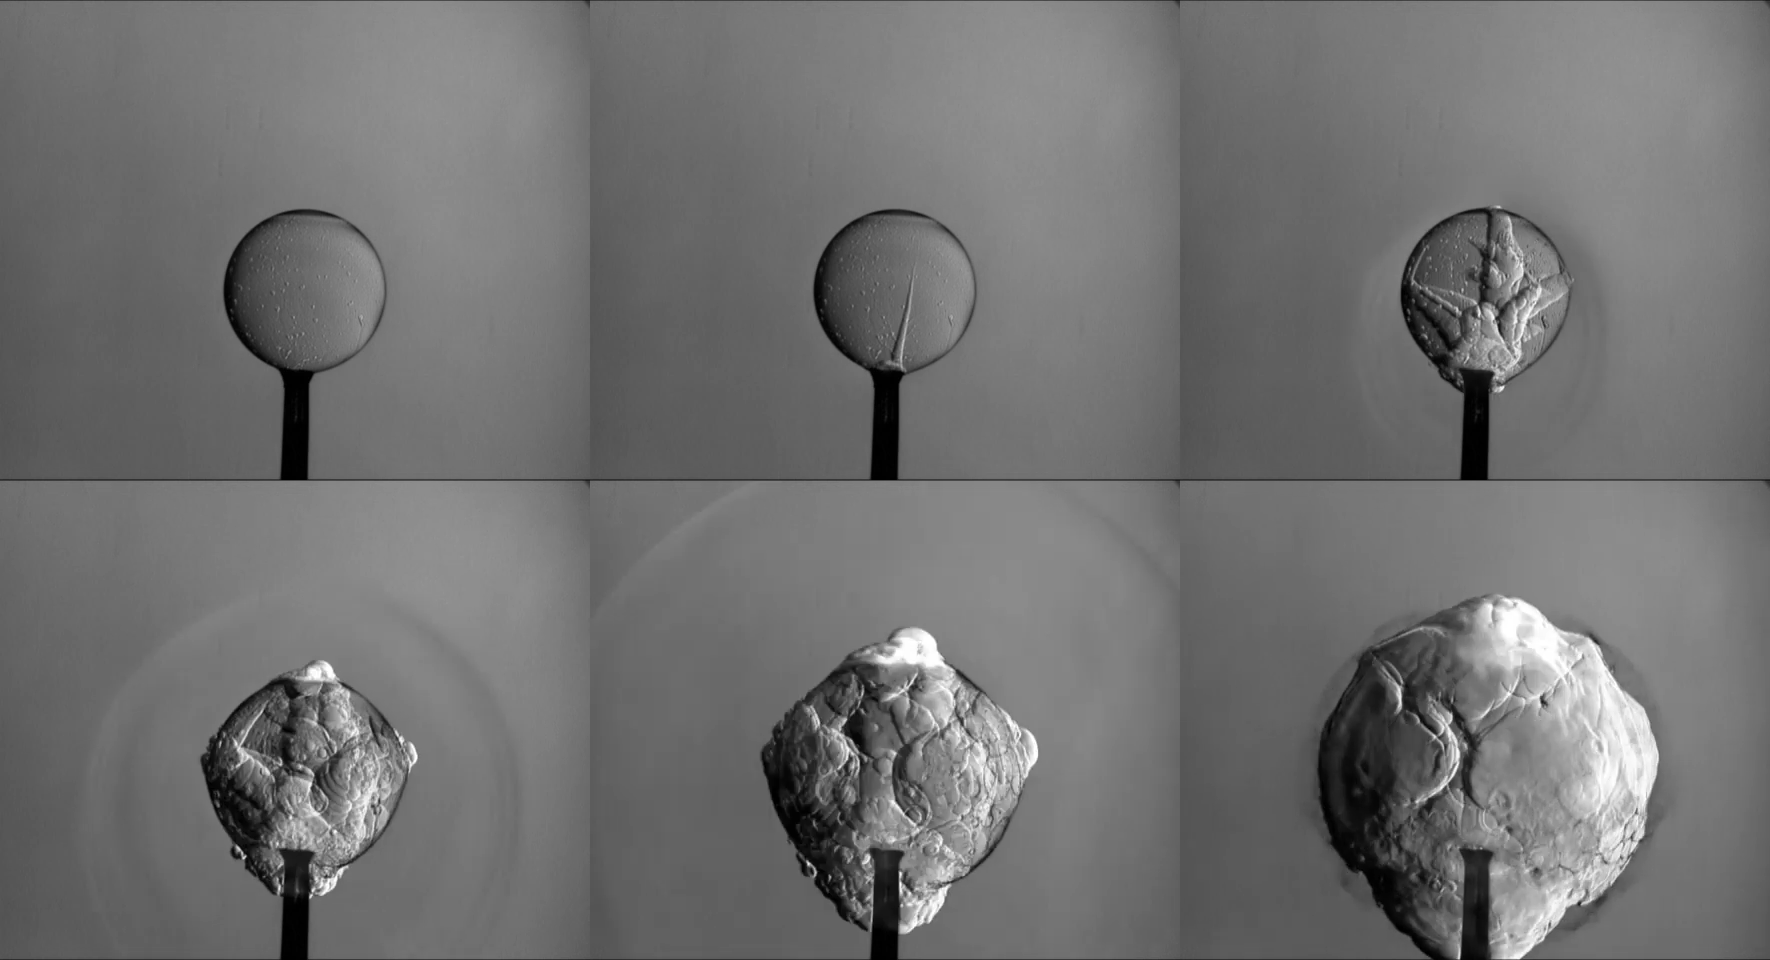
In this high-speed video, artist Linden Gledhill ignites a mixture of oxygen and hydrogen contained within a soap bubble. As neat as the video is, I decided to take a closer look at the initial detonation with this animation:
The ignition sequence within the bubble, slowed down further.
Even here, it’s hard to appreciate just how fast ignition is; it lasts only a handful of frames, despite filming at 40,000 frames per second. But we can still pick out some very neat physics. The ignition begins with a spike-like jet but immediately forks into three ignition fronts that pierce the soap bubble. You can see the shadowy mist of the bubble bursting as the flame front expands. Watch the background carefully, and you can see a shock wave flying away from that moment of detonation.
Once the soap bubble is gone, the expanding flames begin to wrinkle and deform. Turbulence takes shape, eddying through the flames at a much slower speed than the initial detonation. This is where most of combustion takes place, with turbulence mixing the hydrogen and oxygen together to better enable burning. (Image and video credit: L. Gledhill)
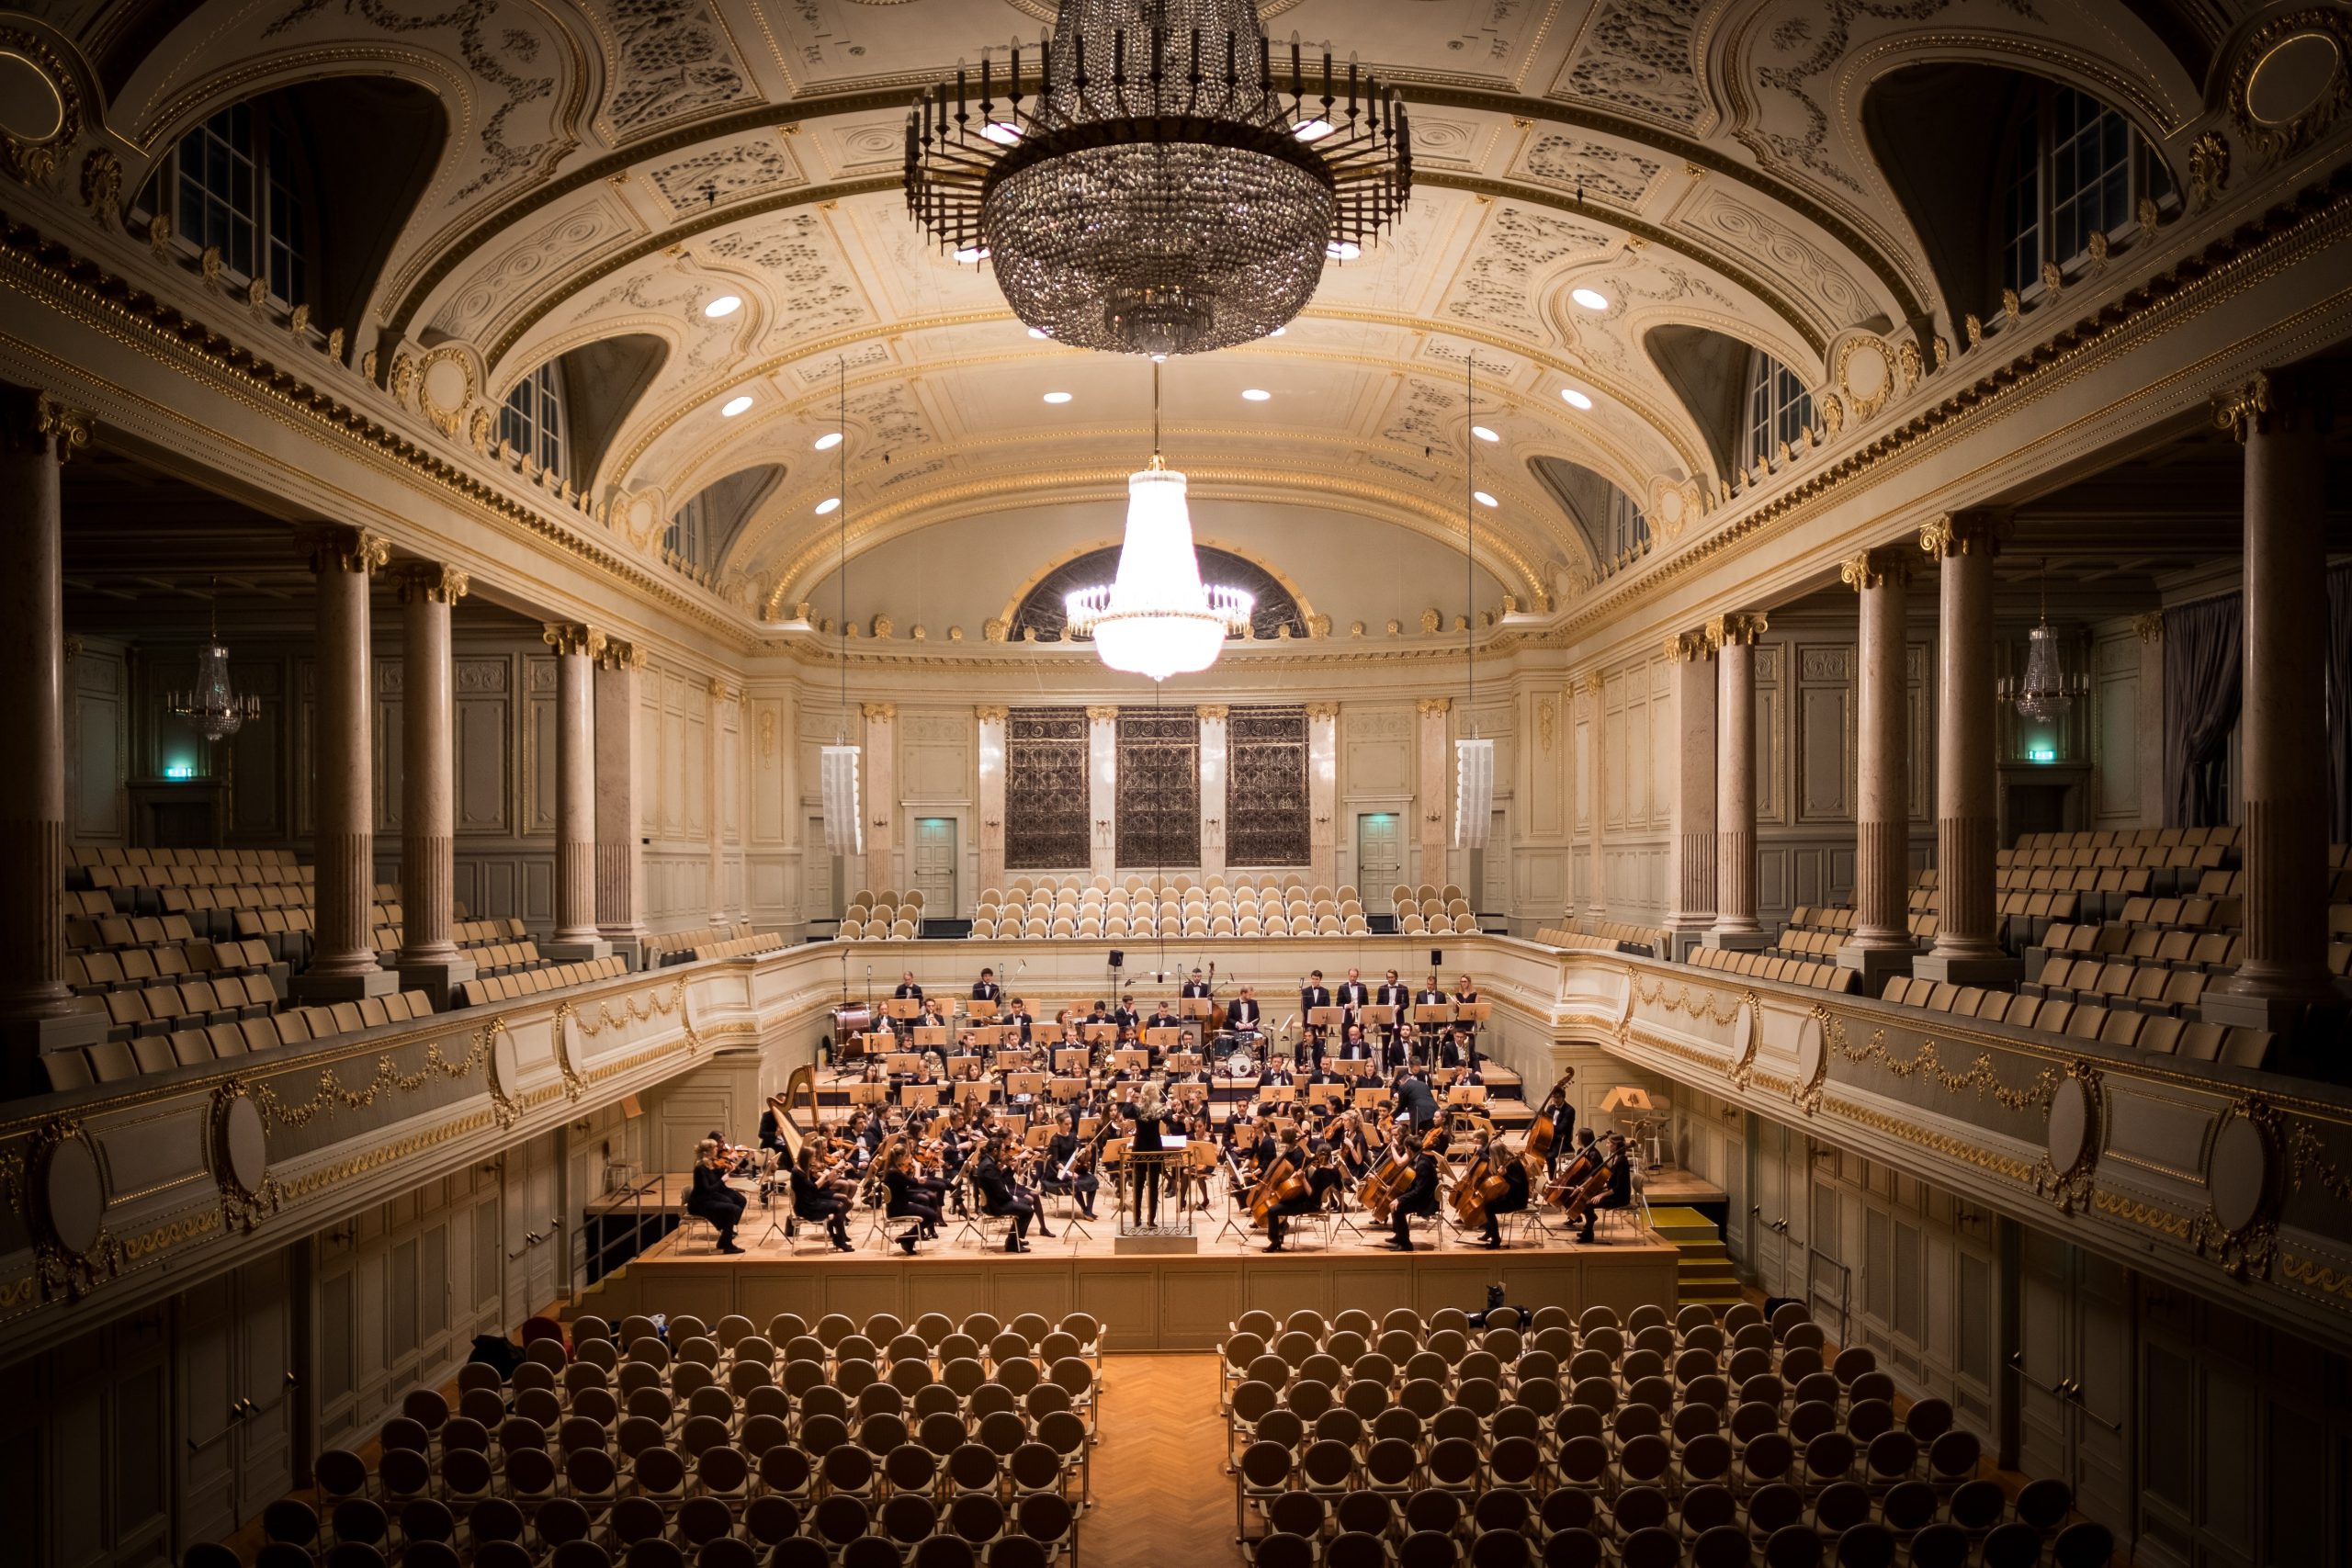
Few industries saw more disruption from the pandemic than the performing arts. To help orchestras return to the concert hall in a way that keeps performers and audience members safe, researchers have simulated air flow and aerosols around musicians onstage. Some instruments — like the trumpet — are super-spreaders when it comes to aerosol production, and, in the conventional organization of orchestras, those aerosols have to travel through other sections of the orchestra before reaching air vents, putting more musicians at risk.
(Upper row) Aerosol concentration for the orchestra’s original seating arrangement (left) and in the modified arrangement (right). (Bottom row) Time-averaged concentration of aerosol particles in the breathing zone of each musician in the original (left) and modified arrangements (right).
Using Large Eddy Simulation, researchers looked at alternate seating arrangements for the Utah Symphony that could mitigate these risks. By rearranging the musicians so that instruments that produce lots of aerosols are closer to the air vents and open doors, the team reduced the average concentration of aerosols around musicians by a factor of 100, giving the performers a chance to return to the stage far more safely. (Image credit: top – M. Nägeli, simulation – H. Hedworth et al.; research credit: H. Hedworth et al.; via NYTimes; submitted by Kam-Yung Soh)
Stratocumulus clouds cover about 20% of Earth’s surface at any given time, and they form distinctive patterns of lumpy cells separated by thin slits. Because of their interconnectedness, researchers nicknamed these narrow regions spiderwebs. New simulations show that evaporative cooling along the cloud tops drives the formation of these spiderwebs (Image 2). Without it (Image 3), the cloud pattern looks very different. (Image credits: featured image – L. Dauphin/MODIS, others – UConn ME 3250; research credit: G. Matheou et al.)
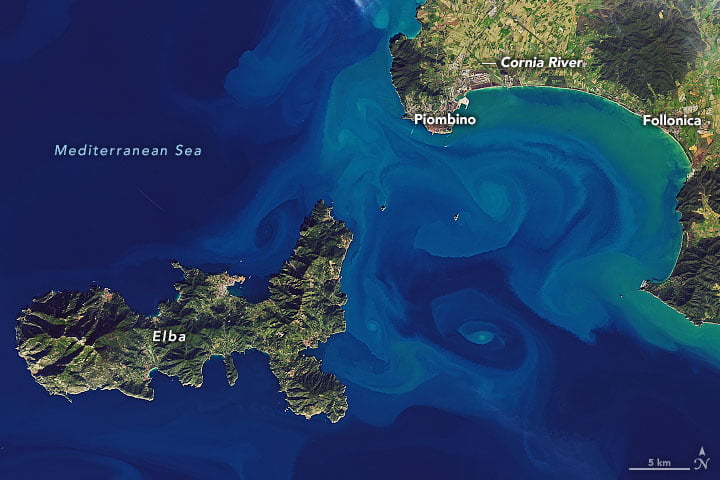
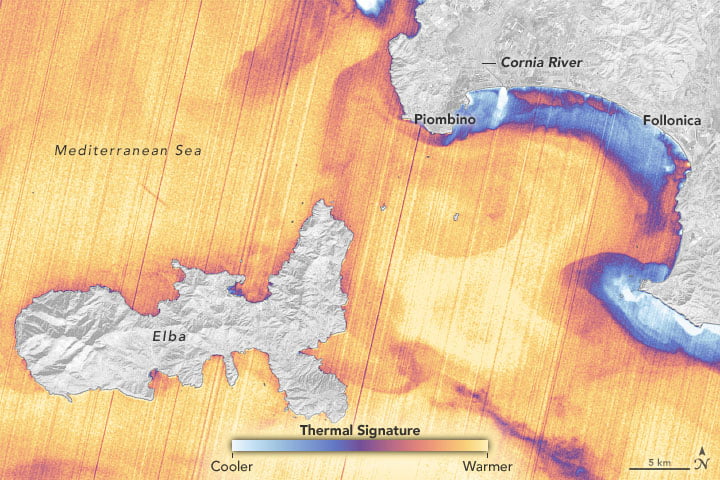
Colorful, sediment-laden eddies swirl off the Italian coast in this satellite image. These small-scale eddies — less than 10 km in diameter — can be short-lived and are often difficult to capture in numerical models, but remote sensing can help scientists better understand their impact on oceanic mixing, especially when we capture more than one view of the same event.
The image below shows the same eddies in an infrared (thermal) view. The resolution on this instrument is not as fine as the natural color one, but we can still make out some of the same swirling motions. It’s also worth comparing the features we don’t see in both images. For example, the Cornia River discharges in infrared as a bright, white plume of cooler water, but it’s barely visible in the color-image, suggesting that the river is not contributing much sediment to the bay. (Image credit: USGS; via NASA Earth Observatory)