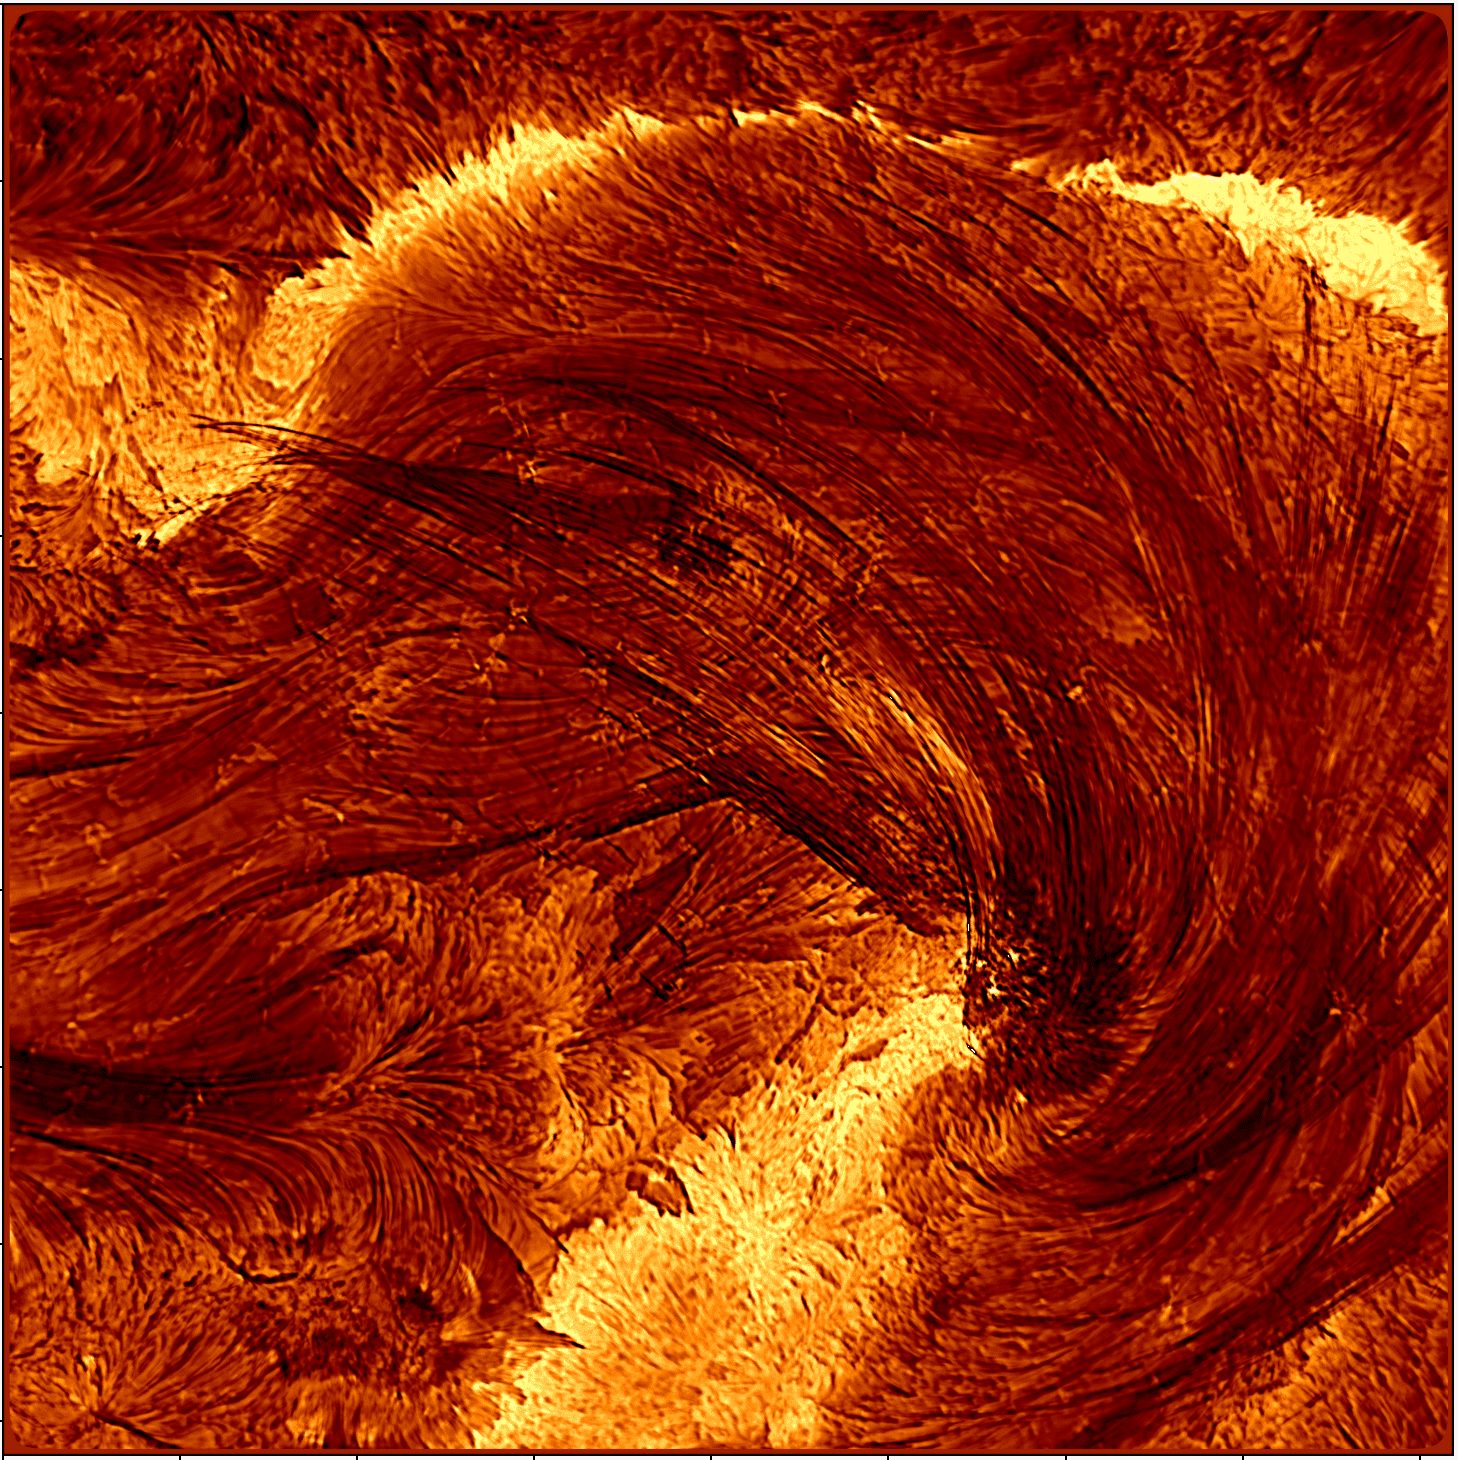
In “Re:Birth,” videographer Vadim Sherbakov explores the fascinating patterns of ferrofluids, which suspend tiny ferrous particles in another liquid, often oil. When this magnetic liquid is mixed with ink or paint, its black lines take on a labyrinthine appearance. The result is rather psychedelic, especially with Sherbakov’s bold colors. (Video and image credit: V. Sherbakov)
Search results for: “art”

Ice Discs Surf on Herringbones
Inspired by the roaming rocks of Death Valley, researchers went looking for ways to make ice discs self-propel. Leidenfrost droplets can self-propel on herringbone-etched surfaces, so the team used them here, as well. On hydrophilic herringbones, they found that meltwater from the ice disc would fill the channels and drag the ice along with it.
But on hydrophobic herringbone surfaces, the ice disc instead attached to the crest of the ridges and stayed in place–until enough of the ice melted. Then the disc would detach and slingshot (as shown above) along the herringbones. This self-propulsion, they discovered, came from the asymmetry of the meltwater; because different parts of the puddle had different curvature, it changed the amount of force surface tension exerted on the ice. Thus, when freed, the ice disc tried to re-center itself on the puddle.
The team is especially interested in how effects like this could make ice remove itself from a surface. After all, it requires much less energy to partially melt some ice than it does to completely melt it. (Image and research credit: J. Tapochik et al.; via Ars Technica)

Flipping Icebergs
When an iceberg flips, it creates waves that can endanger ships nearby, but the move can also trigger further melting. In the ocean, many factors, including wind and waves, can contribute to an iceberg flipping, so researchers studied small, lab-scale versions to see how melting–alone–affects an iceberg’s likelihood of flipping.

The results showed that melting alone was enough to destabilize icebergs and make them flip, as seen in the timelapse above. These mini-icebergs melted faster underwater, changing the berg’s overall shape and eventually triggering a flip. Corners developed at the waterline where the different melt rates above- and below-the-water met. Whenever a flip occurred, one of these corners would always settle at the new water line, causing the lab iceberg to change from a circular cylinder to a polygon as melting continued. (Image credit: M. Whiston; research and video credit: B. Johnson et al.; via APS)

Striations on the Sun
One of the perpetual challenges for fluid dynamicists is the large range of scales we often have to consider. For something like a cloud, that means tracking not only the kilometer-size scale of the cloud, but the large eddies that are about 100 meters across and smaller ones all the way down to the scale of millimeters. In turbulent flows, all of these scales matter. That problem is even harder for something like the Sun, where the sizes range from hundreds of thousands of kilometers down to only a few kilometers.
It’s those fine-scale features that we see captured here. This colorized image shows light and dark striations on solar granules. Scientists estimate that each one is between 20 and 50 kilometers wide. They’re reflections of the small-scale structure of the Sun’s magnetic field as it shapes the star’s hot, conductive plasma. (Image credit: NSF/NSO/AURA; research credit: D. Kuridze et al.; via Gizmodo)

Dusty Clouds Make More Ice
Even when colder than its freezing point, water droplets have trouble freezing–unless there’s an impurity like dust that they can cling to. It’s been long understood in the lab that adding dust allows water to freeze at warmer temperatures, but proving that at atmospheric scales has been harder. But a new analysis of decades’ worth of satellite imagery has done just that. The team showed that a tenfold increase in dust doubled the likelihood of cloud tops freezing.
Since ice-topped clouds reflect sunlight and trap heat differently than water-topped ones, this connection between dust and icy clouds has important climate implications. (Image and research credit: D. Villanueva et al.; via Eos)

A Braided River
The Yarlung Zangbo River winds through Tibet as the world’s highest-altitude major river. Parts of it cut through a canyon deeper than 6,000 meters (three times the depth of the Grand Canyon). And other parts, like this section, are braided, with waterways that shift rapidly from season to season. The swift changes in a braided river’s sandbars come from large amounts of sediment eroded from steep mountains upstream. As that sediment sweeps downstream, some will deposit, which narrows channels and can increase their scouring. The river’s shape quickly becomes a complicated battle between sediment, flow speed, and slope. (Image credit: M. Garrison; animation credit: R. Walter; via NASA Earth Observatory)


Seeking Randomness
Securing information on the Internet requires a lot of random numbers, something computers are not good at creating on their own. This need for random input raises an important philosophical and practical question: what is randomness? How can we be sure that something truly is random, or is it enough for a system to be practically random? Joe explores these questions in this Be Smart video, which shows off how companies use systems — including fluid dynamical ones like lava lamps and wave machines — to generate random numbers for encryption. (Video and image credit: Be Smart)

Rip Currents and Hurricanes
When it comes to the beach, looks can be deceiving. That calm-looking water to the side of big crashing waves may actually be a rip current that carries water back out to the ocean. Rip currents are a result of conservation of mass; just as waves carry water to the shore, something has to carry that incoming water back out to the ocean. Depending on the local topography, that outflow could be below the water surface, creating an undertow, or along the surface, as a rip current.
Even when far offshore, hurricanes can trigger unexpected and strong rip currents, largely because they create bigger waves that travel shoreward. Those waves can also change the depth and layout of the underwater shoreline, potentially exacerbating rip currents.
For more on rip currents, including the latest guidance on how to escape one, check out this article. (Image credit: A. Marlowe; via SciAm)

Falling From the Sky
Artist Sho Shibuya paints daily meditations on a copy of The New York Times. These particular examples are part of a recent collection, Falling From the Sky, that features realistic trompe l’oeil droplets that celebrate rain and rainy days. Having spent many an hour contemplating water droplets on my window, I love these. (Image credits: S. Shibuya; via Colossal)

Aboard a Hurricane Hunter
For decades, NOAA has relied on two WP-3D Orion aircraft–nicknamed Kermit and Miss Piggy–to carry crews into the heart of hurricanes, collecting data all the while. Every ride aboard a Hurricane Hunter is a bumpy one, but some flights are notorious for the level of turbulence they see. In a recent analysis, researchers used flight data since 2004 (as well as a couple of infamous historic flights) to determine a “bumpiness index” that people aboard each flight would experience, based on the plane’s accelerations and changes in acceleration (i.e., jerk).
The analysis confirmed that a 1989 flight into Hurricane Hugo was the bumpiest of all-time, followed by a 2022 flight into Hurricane Ian, which was notable for its side-to-side (rather than up-and-down) motions. Overall, they found that the most turbulent flights occurred in strong storms that would weaken in the next 12 hours, and that the bumpiest spot in a hurricane was on the inner edge of the eyewall. That especially turbulent region, they found, is associated with a large gradient in radar reflectivity, which could help future Hurricane Hunter pilots avoid such dangers. (Image credit: NOAA; research credit: J. Wadler et al.; via Eos)


