In nature, erosion patterns are driven by the interactions of flow and topography. Here, researchers study that process in the lab by placing an inclined block of caramel in quiescent syrup and watching as it dissolves. Initially, the bottom surface of the block develops regularly-spaced plumes — the dark lines seen in the first image. But because the caramel-laden plumes are heavier than the surrounding fluid, the flow quickly becomes unstable. The plumes cross one another and begin to carve chevrons into the caramel.
The chevrons appear to march their way upward in the video. They slowly grow and change into a distinctly scalloped pattern. Scallops like these are often seen by geologists in caves and icebergs, and the authors argue that their results and modeling indicate the importance of buoyant flow effects on such natural formations. (Image and research credit: C. Cohen et al.)
In Roman Hill’s “As Above,” we see expansive celestial landscapes: nebulae, the corona of a star, and expanding interstellar dust clouds. Except, in reality, we are watching fluids undergoing a chemical reaction, on a canvas only 8 square millimeters in size. It’s a fun — and beautiful — reminder that the patterns of physics repeat across many scales. (Video and image credit: R. Hill)
One of my favorite aspects of fluid dynamics is how well it pairs with so many other fields, from mathematics and space exploration to biology, medicine, and even paleontology. That last field is key to today’s question, namely: how did a prehistoric reptile the size of an F-16 manage to fly?
As Joe’s video describes, many factors went into Quetzalcoatlus’ flight. The pterosaur had strong but hollow bones to save on weight while anchoring flight muscles. Its wing shape mimicked an airfoil’s. And, finally, it overcame the challenge of taking off by using both its front and hind limbs to leap off the ground, much like modern bats do.
There’s no doubt that it would be stunning (and probably terrifying!) to see these creatures in action. But you may wonder how scientists piece together these animals from incomplete fossils. Don’t worry! There’s a video for that question, too. (Video and image credit: It’s Okay to Be Smart; see also the video’s references)
Rising bubbles and droplets are common in many chemical and industrial applications. But just a tiny concentration of contaminants on their surface can completely alter their behavior, disrupting coalescence and slowing down chemical reactions.
Historically, it’s been hard to measure the level of contamination in these some drops and bubbles, but a new study outlines a way to measure these small concentrations by perturbing the drops and watching how they deform. By analyzing how the drop shimmies and shakes, they’re able to measure its surface tension and, ultimately, the concentration of contaminants. (Image credit: S. Sørensen; research credit: B. Lalanne et al.; via APS Physics)
Academia, like every part of our society, has a race problem. Today, I’m joining in the effort to change that by taking a break from business as usual and examining the issues facing my Black colleagues and what I can do to change them. I encourage you to do the same, and if you stick around, I’ll give you some ways to help!
The Current State of Affairs
Physics and engineering struggle across the board with diversity. According to a 2020 report from the American Physical Society (APS, home to my professional society, the Division of Fluid Dynamics, or DFD), my society’s membership is currently about 14% female. That’s actually an improvement over 3 years ago, when we were all of 11% female. APS doesn’t even publish unit-level statistics on racial and ethnic minorities, though they do report statistics for minorities across physics as a whole.
As someone without an academic institution, I’m somewhat limited in my capacity to change the culture there. I have no say in hiring or tenure decisions. (If you are at a university, here are some resources that may help you create change.)
But my work does play an important role in increasing visibility for minorities in physics in engineering, including African Americans. To that end, I pledge to redouble my efforts to feature the voices and work of Black fluid dynamicists.
I also want to support organizations that help Black physicists and engineers like the National Society of Black Physicists, the National Society of Black Engineers, and African American Women in Physics. And this is where you can help! For the next month, I will donate all of my proceeds from the sales of FYFD merchandise to these organizations. Moreover, I will personally match those proceeds with my own donation (up to $500). So if you’ve been thinking about grabbing a t-shirt or some stickers to share your love of fluid dynamics, now’s a great time!
It’s important to recognize that #ShutDownSTEM is about more than one day. It’s about making a sustained commitment to eliminate anti-Black racism in STEM and academia. To that end, I include here some useful resources, both on general anti-racism efforts and on academic ones in particular. I hope you’ll join me in making our field more diverse and inclusive.
Meet Some Black Physicists, Engineers, and Fluid Dynamicists
This list is in no way comprehensive, but I want to highlight some of the amazing Black folks who have and are working in these fields. Have recommendations for more? Let me know in the comments or on Twitter.
Recent changes to the Golden Gate Bridge’s guardrails have created a new soundscape in the Bay Area. Under high winds, the bridge gives off an eerie, otherworldly wail that can be heard even miles away. The new guardrails are substantially thinner than the previous ones, which reduces the wind load the bridge has to endure. But that thinner profile is also what causes the noise, through a well-known phenomena known as vortex shedding.
Animation of vortex shedding behind a cylinder. (Image credit: Wikimedia)
As air moves past a non-streamlined body, like a cylinder, it forms counter-rotating vortices that peel off the body at a set frequency. Fluid dynamicists use a non-dimensional number, the Strouhal number, to characterize this vortex shedding. For a simple shape like a cylinder, the Strouhal number is relatively constant, so I decided to do a quick and dirty calculation to examine the wind velocities responsible for the sound. (See also my analysis of Star Trek Voyager’s opening sequence.)
I began by collecting several videos with samples of the bridge’s singing (1, 2, 3). Then I used Adobe Audition to analyze the frequency content of the bridge noise. Below is a sample snapshot from a video taken on the bridge’s bike path, right next to the guardrail. The analysis shows three broad, but distinct peaks: a primary peak at 430 Hz, a small harmonic of that frequency at 860 Hz, and a separate, secondary peak centered at 1070 Hz. The broadness of the peaks, along with the competition between the primary and secondary peaks, is probably responsible for the disconcerting, discordant nature of the sound.
Frequency analysis of the Golden Gate Bridge’s “singing”, taken from a section of this video. (Image credit: N. Sharp)
Of the other videos I analyzed, a second video from near the bridge also showed the 430 Hz peak, while a video from further away had a dominant frequency of 517 Hz. There’s a lot of uncertainty introduced in not knowing exactly when each video was filmed, but given the agreement between videos 2 and 3, I suspect that video 1’s higher frequency may be caused by interference and modulation as the sound travels.
With the major frequency in hand, I estimated the size of the new guardrail wires as 10mm in diameter. After some tweaking to adjust the Reynolds number and Strouhal numbers, that gave me an estimated wind speed of 21 meters per second, or about 47 miles per hour. That’s right in line with the 43 miles per hour discussed by the news anchors.
What if the guardrails are a little thinner? If the wires are about 7.5 mm in diameter, then it only takes winds at about 15 meters per second (34 miles per hour) to create that 430 Hz note.
Keep in mind that this analysis doesn’t predict the minimum wind speed needed to create the audible noise; all I’m able to do is a back-of-the-envelope calculation of what the likely wind speed was when a video was recorded. Nevertheless, I hope you’ll find it interesting! (Video credit: KPIX CBS News; image credits: vortex shedding – Wikimedia, frequency analysis – N. Sharp; submitted by Christina T.)
This stunning new image of Jupiter in infrared is part of a data set combining measurements from ground- and space-based observatories. The glowing Jovian orb seen here is a composite of some of the sharpest images captured by the Gemini North Telescope’s Near-Infrared Imager from its perch on Mauna Kea. The brightest areas correspond to warmer temperatures over thinner, hazier clouds, whereas the dark areas mark towering, thick clouds.
The ground-based images — and observations from Hubble — were timed to coincide with passes from the Juno spacecraft. This combination of infrared, visible light, and radio wave observations gives scientists an unprecedented look at Jovian atmospheric processes. It revealed, for example, that lightning measured by Juno deep inside Jupiter’s atmosphere corresponded to convective storm cores visible to the other imagers. The combination of observations allowed the researchers to reconstruct the structure of these Jovian storms in a way that no single instrument could reveal. No doubt planetary scientists will learn lots more about Jovian convection from the data set. (Image credit: Jupiter – International Gemini Observatory/NOIRLab/NSF/AURA, M.H. Wong (UC Berkeley)/Gizmodo, illustration – NASA, ESA, M.H. Wong (UC Berkeley), and A. James and M.W. Carruthers (STScI); research credit: M. Wong et al.; via Gizmodo)
Placing a mixture of alcohol and water atop a pool of oil creates a stunning effect that pulls droplets apart. The action is driven by the Marangoni effect, where variations in surface tension (caused in this case by the relative evaporation rates of alcohol and water) create flow. David Naylor captures some great stills of the flow, including the only example of a double burst I’ve seen so far. For more on the science behind the effect, check out this previous post or the original research paper. (Image credit: D. Naylor; see also this previous post)
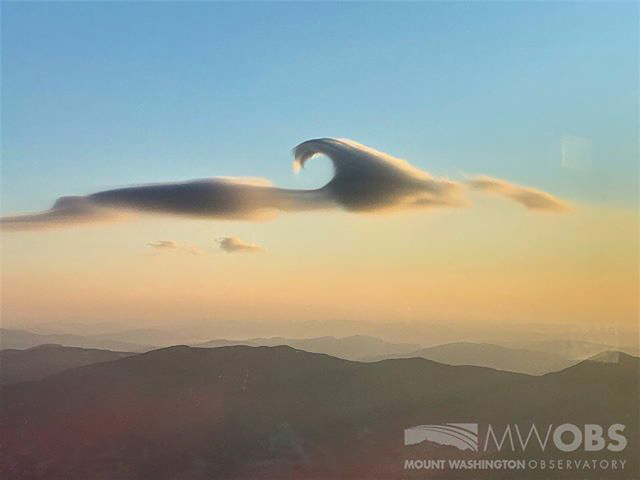
Lens-shaped lenticular clouds are not terribly rare in mountainous areas, but observers at Mount Washington caught a very unusual cloud near sunrise in late February. This lenticular cloud had an added curl on top thanks to the Kelvin-Helmholtz instability!
Lenticular clouds form when air is forced to flow up over a mountain in such a way that its temperature and pressure drop and water vapor in the air condenses. The resulting water droplets form a cloud that appears stationary over the mountain, even though the air continues to flow.
To get that added wave-like curl, there needs to be another, faster-moving layer of air just above the cloud. As that air flows past, it shears the cloud layer, causing the interface to curl. Neither of these cloud types is long-lived — Kelvin-Helmholtz formations often last only a few minutes — so catching such a great dual example is lucky, indeed! (Image credit: Mount Washington Observatory; via Smithsonian Magazine; submitted by Kam-Yung Soh)
The Glen Canyon Dam lies on the Colorado River, upstream of the Grand Canyon. Because the dam blocks sediment from upstream, the region’s only sediment sources are two tributary rivers downstream of the dam. Periodically, the Bureau of Reclamation releases high flows from the dam in order to mimic the seasonal floods that existed on the river before the dam was built. These surge flows pick up hundreds of thousands of tonnes of sediment from the tributary rivers and push it downstream, creating and renewing sand bars and beaches along the Colorado. (Video and image credits: Bureau of Reclamation, 1, 2)


