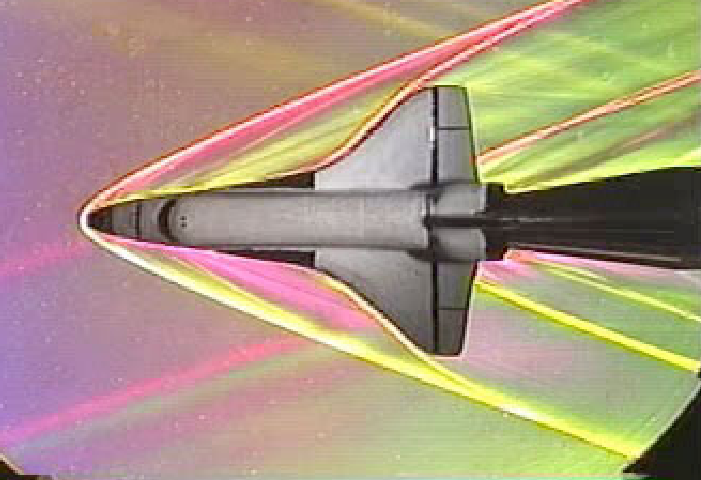
The Space Shuttle had a famous double sonic boom when passing overhead during re-entry. This schlieren flow visualization of a model shuttle at Mach 3 reveals the source of the sound: the fore and aft shock waves on the vehicle. The nose of the shuttle generates the strongest shock wave since it is the first part of the vehicle the flow interacts with. This initial shock wave turns the flow outward and around the shuttle. The second boom comes from the back of the shuttle and serves to turn the flow back in to fill the wake behind the shuttle. (The actual shock wave would look a little different than this one because there’s no sting holding the shuttle like there is with the model.) The other major shock wave comes from the shuttle’s wings, but, at least for this Mach number, the wing shock wave merges with the bow shock, making the two indistinguishable. (Image credit: G. Settles, source)
Tag: schlieren photography

Bubbles Sliding


Two-phase flows involve more than one state of matter – in this case, both gas and liquid phases. Flows like this are common, especially in applications involving heat transfer. In some heat exchangers, bubbles will rise and then slide along an inclined surface, as shown above. The motion of these bubbles is a complicated interplay between the surface, the bubble, and the surrounding fluid. The bubble’s wake, visualized here using schlieren imaging, is unsteady and turbulent. Although the bubble oscillates in its path, the wake spreads even wider, and its turbulence stirs up the liquid nearby, increasing the heat transfer. (Image and research credit: R. O’Reilly Meehan et al., source)

Shadows of Flow
In the latest Veritasium video, Derek demonstrates how to see gas motions that are normally invisible using a schlieren photography set-up. Schlieren techniques have been important in fluid dynamics for well over a century, and Derek’s set-up is one of the two most common ways to set up the technique. (The other method uses two collimating mirrors instead of a single spherical or parabolic one.) As explained in the video, the schlieren optical set-up is sensitive to small changes in the refractive index, making density changes or differences in a gas visible. This makes it possible to distinguish gases of different temperatures or compositions and even lets you see shock waves in supersonic flows. (Video and image credit: Veritasium; submitted by Paul)

Quad Copter Schlieren
Schlieren photography is a classic method of flow visualization that utilizes small variations in density (or temperature) to make otherwise unseen air motion visible. Because changing air’s density or temperature changes its index of refraction, variations in either quantity show up as dark and light regions. Here researchers use it to reveal some of the airflow around a small quadcopter, including the vortices that spiral off each propeller and help generate the lift necessary for take-off. The full video includes a couple of neat demos, including what happens when the blades are wet (shown below). In that case, the wingtip vortices are somewhat disrupted by strings of water droplets being flung off the blades by centrifugal force. Beautiful! (Video and image credit: K. Nolan et al., source; submitted by J. Stafford)


Fanning the Flame
A fan’s blade passes through the hot air rising above a flame in this iconic image by high-speed photography pioneer Harold Edgerton. This photo uses an optical technique known as schlieren photography that makes density differences in transparent media like air visible. Because of its lower density, the hot plume of air above the flame rises. When the fan blade swings past, it sheds a vortex off its tip and the rising air from the flame gets pulled into the vortex to make it visible. To the left, a ghostly counter-rotating vortex sits on the opposite side of the fan blade. (Photo credit: H. Edgerton and K. Vandiver)
Popping
Popcorn’s explosive pop looks pretty cool in high-speed video, but just watching it with a regular camera doesn’t show everything that’s going on. If we take a look at it through schlieren optics, the kernel’s pop looks even more extraordinary:

The schlieren technique reveals density differences in the gases around the corn–effectively allowing us to see what is invisible to the naked eye. The popcorn kernel acts like a pressure vessel until the expansion of steam inside causes its shell to rupture. The first hints of escaping steam send droplets of oil shooting upward. The kernel may hop as steam pours out the rupture point, causing the turbulent billowing seen in the animation above. As the heat causes legs of starch to expand out of the kernel, they can push off the ground and propel the popcorn higher. As for the eponymous popping sound, that is the result of escaping water vapor, not the actual rupture or rebound of the kernel! See more of the invisible world surrounding a popping kernel in the video below. (Image credits: Warped Perception, source; Bell Labs Ireland, source; WP video via Gizmodo; BLI video submitted by Kevin)

The Sound of a Balloon Popping
The pop of an overfilled balloon is enough to make anyone jump, but you’ve probably never seen it like this. The photo above uses an optical technique known as schlieren photography that reveals changes in density of a transparent gas like air. The shredded rubber of the balloon is still visible in black, and around the balloon there’s an expanding spherical shock wave. It’s the sudden release of energy when the balloon ruptures and the gas inside begins to expand that causes the shock wave. Notice, though, that the gas from the balloon is still clearly visible and balloon-shaped–much like a water balloon that’s just popped. From that clear delineation, I would say that this balloon was filled with a different gas than air–otherwise the density shouldn’t be different enough to make the interior gas distinguishable. (Image credit: G. Settles)
Starting a Lighter
Lots of fluids are transparent, which makes it hard for us to appreciate their motion. One technique for making these invisible motions visible is schlieren photography, which makes differences in density visible. Here it’s combined with high-speed video to show what happens when you use a lighter (minus the spark!). When the fuel starts flowing, it’s unstable and turbulent, but after that initial start-up, you can see the jet settle into a smooth and laminar flow. Wisps of fuel diffuse away from the jet as the fluid disperses. As the valve shuts off, the flow becomes unstable again, and the remains of the lighter fluid diffuse away. (Video credit: The Missing Detail)

Shock Waves in Flight

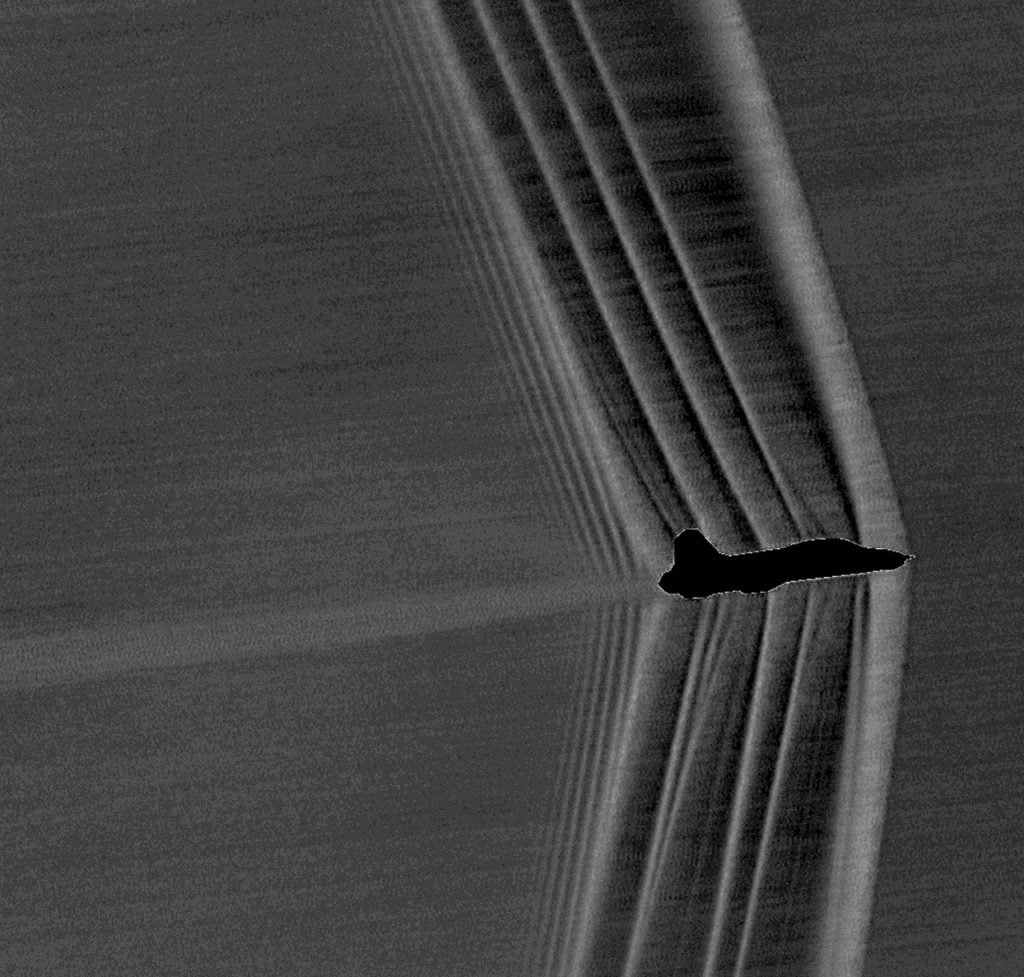
This week NASA released two new images of the shock waves surrounding T-38C jets in free flight. They’re the result of NASA’s new adaptations of the schlieren photography technique, which has let scientists visualize shock waves (in the lab, at least) for more than a century. To celebrate, I thought it would be fun to demonstrate some of the data engineers can extract from images like the one above. So I’m going to show you how to calculate how fast this plane was flying!
Shock waves depend a lot on geometry. This is not too surprising, really, since shock waves are nature’s way of quickly turning the air because there’s an object in the way. This leads to a very powerful observation, though: the angle of a shock wave depends on the geometry of the object and the Mach number of the flow. (The Mach number is the ratio of an object’s speed to the local speed of sound, so an object moving at Mach 1 is moving at the speed of sound.)
The reverse observation is also true: if we can measure the angle of a shock wave from a known geometry, then we can calculate the Mach number. Now, I don’t have any special information about the geometry of a T-38, so most of the shock waves in this picture can’t tell me much quantitatively.
But, it turns out, I don’t need to know anything about the geometry of the plane to figure out its Mach number. That’s because that very first shock wave over on the right is coming off a sharp probe mounted over the airplane’s nose. The probe is sharp enough, in fact, that I can treat it as though it’s a tiny point disturbance. That means that rightmost shock wave is a special kind of shock known as a Mach wave, and its geometry depends solely on the Mach number. It’s a pretty simple equation, too:

So, all I have to do is fire up some software like GIMP or ImageJ and estimate the angle of that first shock wave.

I came up with an estimate of about 77 degrees for the shock wave angle, which gives Mach 1.026 for the plane’s speed. Keep in mind that a) I’m using a grainy photo; and b) I have no information about the plane’s orientation relative to the camera. Nevertheless, NASA’s caption reports that this plane was moving at Mach 1.05 in the picture. My quick and dirty estimate is only off by 2%!
Of course, engineers are interested in a lot more than estimating an aircraft’s speed from these photos. With a little more geometry information, they can gather a lot of useful data from these images. One of the goals for the new photography technique is to help study new aircraft designs that generate weaker shock waves and quieter sonic booms. (Original images: NASA)
Ignition
Shown here are the first instants after a bubble full of methane gas is ignited via laser. Using the schlieren optical method and a high-speed camera, scientists recorded the deflagration at 10,000 frames per second. Because schlieren imaging is very sensitive to small changes in density, we see not only the expanding flame front as the methane ignites but also the subtle waviness of the methane expanding into the surrounding air as the bubble bursts. (For comparison, check out what bursting a water balloon looks like at high-speed.) Be sure to head over to ScienceTake for the full schlieren video, and also check out this award-winning video of a match lighting made by the same researcher. (Image credit: V. Miller et. al.; full video: The New York Times; submitted by Rebecca M.)
ETA: An earlier version of this post mistakenly said the demo used a balloon full of methane rather than a bubble. Thanks to jump-first-think-later for the correction.


